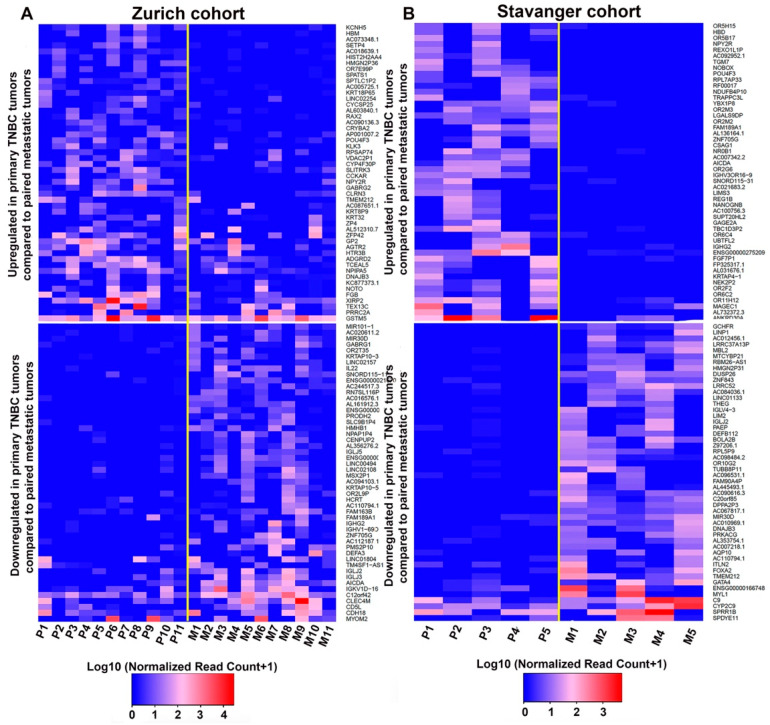
Figure 2.
DEGs between primary and metastatic TNBC tumors. (A,B) Heatmap showing the top 100 upregulated (top) and downregulated (bottom) genes in primary TNBC tumors (n = 11) compared to matched metastatic tumors (n = 11) in the Zurich cohort (A) and in primary TNBC tumors (n = 5) compared to matched metastatic tumors (n = 5) in the Stavanger cohort (B). P = Primary tumor; M = Metastatic tumor.

