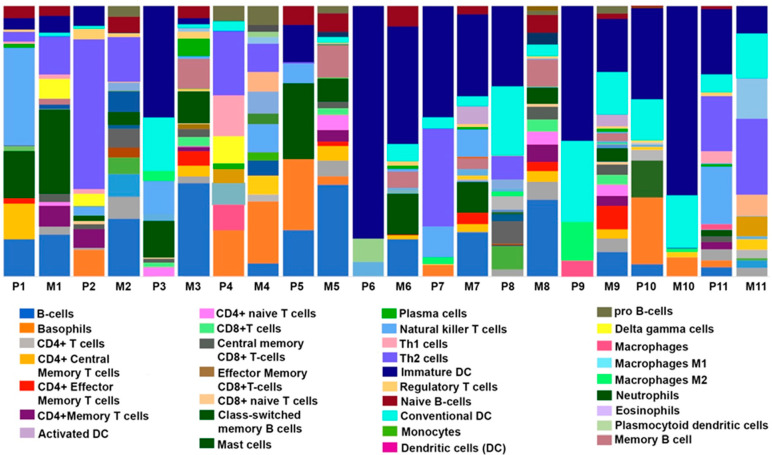
Figure 4.
Cellular landscape of immune microenvironment in primary TNBC tumors and matched metastatic lesions. The proportions of immune cells in each TNBC (primary “P”; n = 11 or metastatic “M” tumors; n = 11) sample are indicated with different colors. The lengths of the bars in the bar charts indicate the levels of the immune cell populations.

