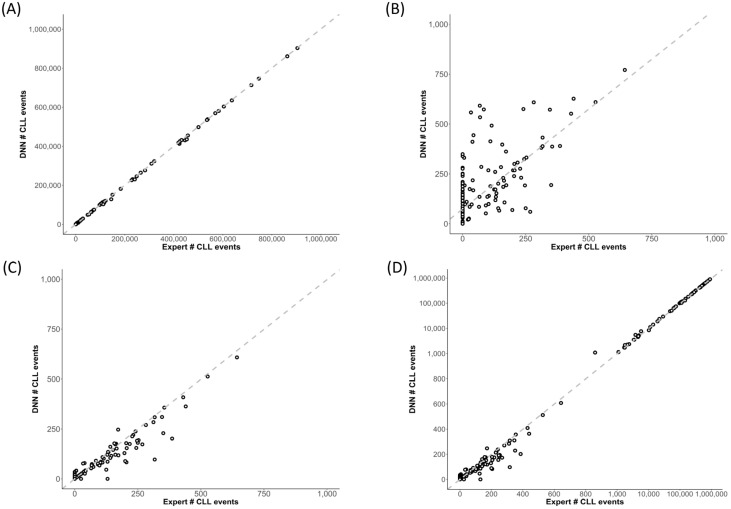
Figure 2.
Scatterplots showing expert analysis and DNN inference of abnormal CLL events in the test cohort. (A,B) F-DNN inferences showed excellent correlation with the expert abnormal CLL event counts (Pearson correlation coefficient, r > 0.99); (A), except at abnormal CLL event counts less than 1000 (r = 0.70). (B) The dashed line represents the Passing–Bablok regression line for the F-DNN inferences versus the expert “ground truth”: slope = 1.001 (95% CI: 0.998–1.010) and intercept = 74.000 (95% CI: 60.831–93.835). (C) The L-DNN showed an improved correlation with the expert “ground truth” at abnormal CLL event counts less than 1000 (r = 0.96). (D) Using the F-DNN inference if greater than or equal to 1000 abnormal events and the L-DNN inference if less than 1000 abnormal events resulted in excellent correlation throughout the analyzed range (r > 0.99) with a Passing–Bablok regression slope of 0.998 (95% CI: 0.995–1.000) and the intercept of 0.000 (95% CI: 0.000–0.046), shown in subplots (C,D).

