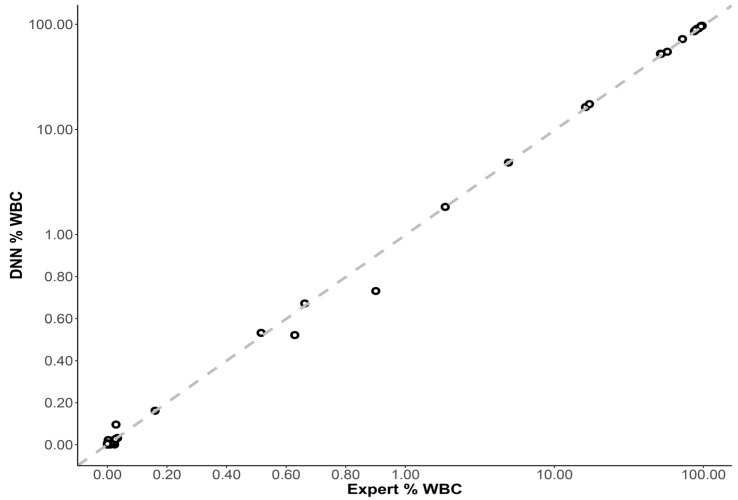
Figure 4.
Scatterplot showing expert and DNN inference of abnormal CLL events as a % of total white blood cells (WBCs) for each unknown case (n = 60, including the serial dilution samples). The dashed line represents the Passing–Bablok regression line: slope = 0.997 (95% CI: 0.988–0.999) and intercept = 0.001 (95% CI: 0.000–0.001).

