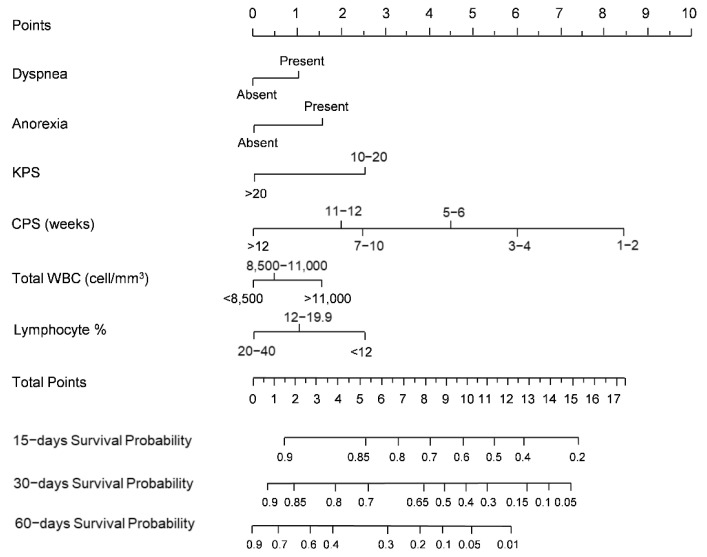
Figure 1.
PaP score nomogram (development cohort) predicting 15-, 30-, and 60-day survival. To estimate risk, points were assigned for each independent variable by drawing a line upward form the variable value to the axis labeled “Points”. All points were then summed and plotted on the “Total points” axis; then, a straight line was drawn from the total points axis to the 15-, 30- and 60- days survival axis. KPS: Karnofsky Performance Status; CPS: Clinical Prediction of Survival; Total WBC: Total White Blood Count.

