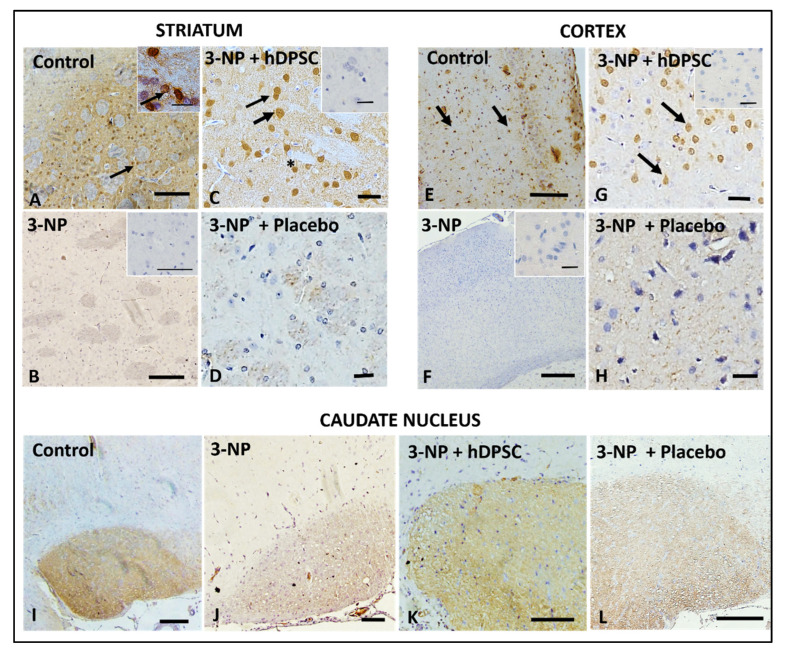
Figure 5.
Expression of anti-BDNF antibody (black arrows) in the striatum (A–D), cortex (E–H) and caudate nucleus (I–L) in control (A,E,I); 3-NP (B,F,J), 3-NP + hIDPSC (C,G,K) and 3-NP + placebo animals (D,H,L), respectively. Insets in (A–C,F,G) show negative control (secondary antibody). Black arrows indicate BDNF expressing cells. Sections are contra-stained with HE. Scale bars: 50 µm (A,B,E,F,I–L) and 100 µm (C,D,G,H). Analysis performed 30 days after (D35) the treatment). Asterisk indicates the enlarged areas. The asterisks indicate the areas that were analyzed in magnification.

