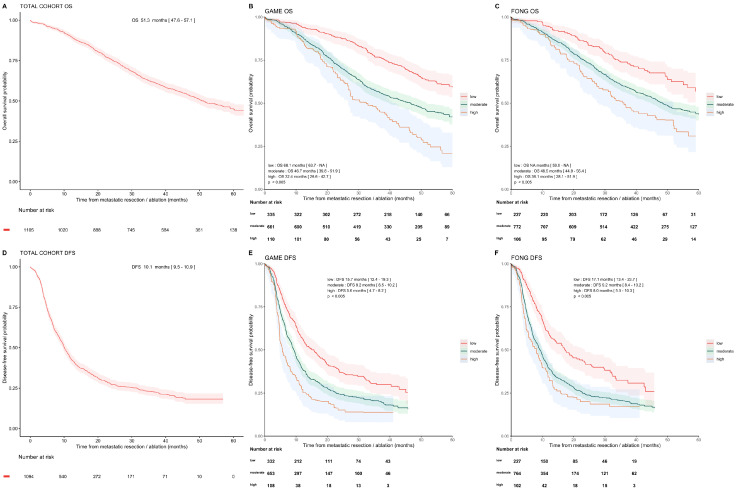
Figure 2.
Overall survival and disease-free survival in cohort and subgroups. Kaplan–Meier analysis showing OS and DFS curves and 95% confidence intervals of the total cohort and for the risk categories following the GAME and Fong scores. OS for total cohort (A), and OS for GAME CRS risk groups (B), OS for Fong CRS risk groups (C). DFS for total cohort (D), DFS for GAME CRS risk categories (E), and DFS for Fong CRS risk categories (F).

