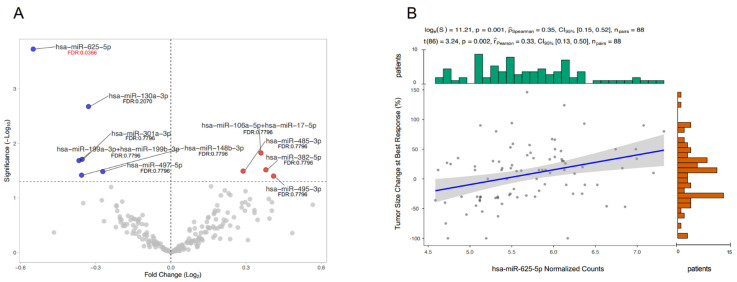
Figure 1.
Differential EV-miRNAs’ expression based on the Objective Response. Volcano Plot shows miRNAs significantly overexpressed on the right (red dots) and miRNAs significantly downregulated on the left (blue dots) (A). Scatter plot representing the correlation between miR-625-5p levels and tumor size change at best response (B).

