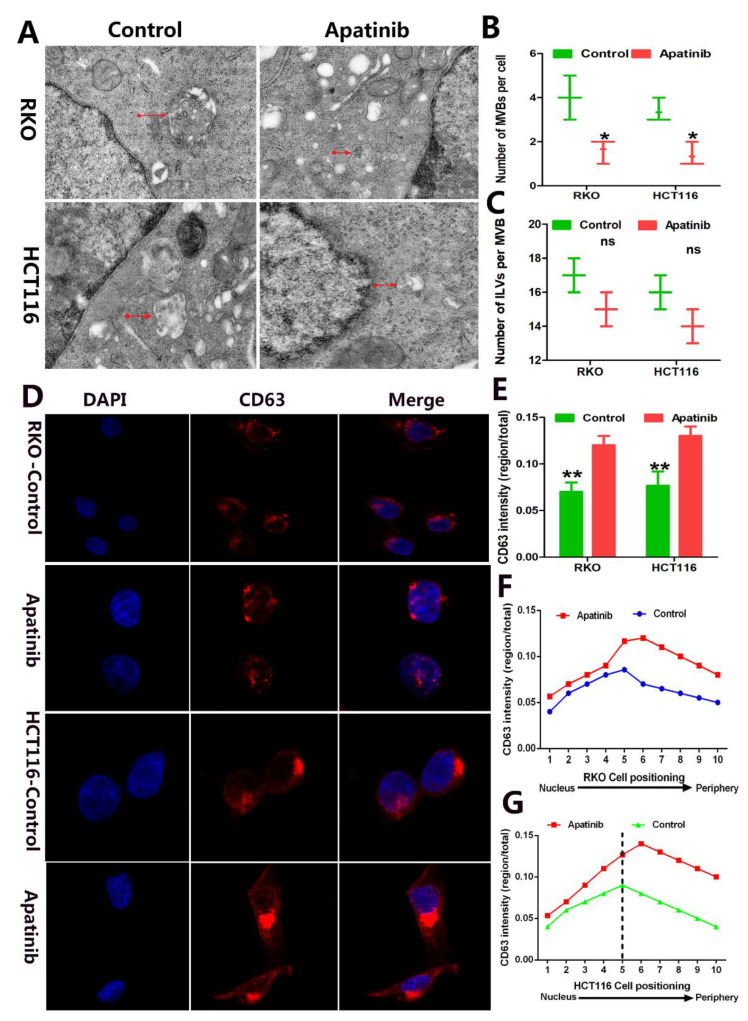
Figure 5.
Apatinib inhibited the transport of MVBs towards the plasma membrane in CRC cells. (A) Representative electron microscopic images of control and apatinib treatment cells. (B) The number of MVBs per cell profile. (C) The number of ILVs per MVB. (D) Immunofluorescence of the control and apatinib-treated cells stained with CD63. (E) Quantification of CD63+ vesicle distribution within the cell. (F,G) Quantification of CD63 intensity within the perinuclear region of RKO and HCT116 cells. * p < 0.05, ** p < 0.01.

