Figure 3.
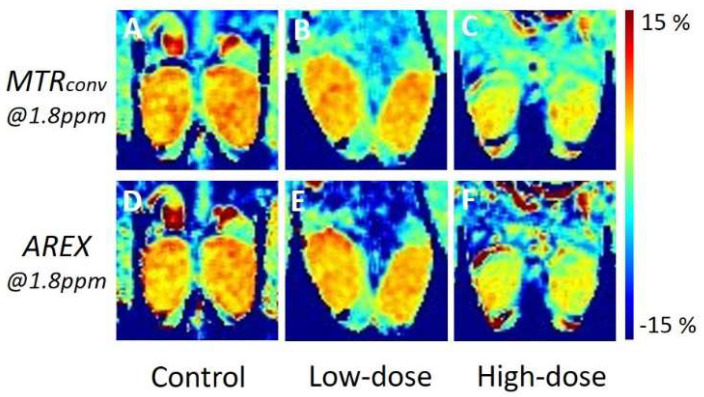
Representative in vivo Cr-CEST images of control and cisplatin-treated mice. The upper row displays the MTR asymmetry map of MTRconv at 1.8 ppm, whereas the bottom row displays the MTR asymmetry map of AREX. The left column represents the control (A,D), the central column represents the low dose (B,E), and the right column represents the high dose (C,F). MTR, magnetization transfer ratio; MTRconv, conventional analysis metric magnetization transfer ratio; AREX, apparent exchange-dependent relaxation; and Cr-CEST, creatine chemical exchange saturation transfer.

