Figure 5.
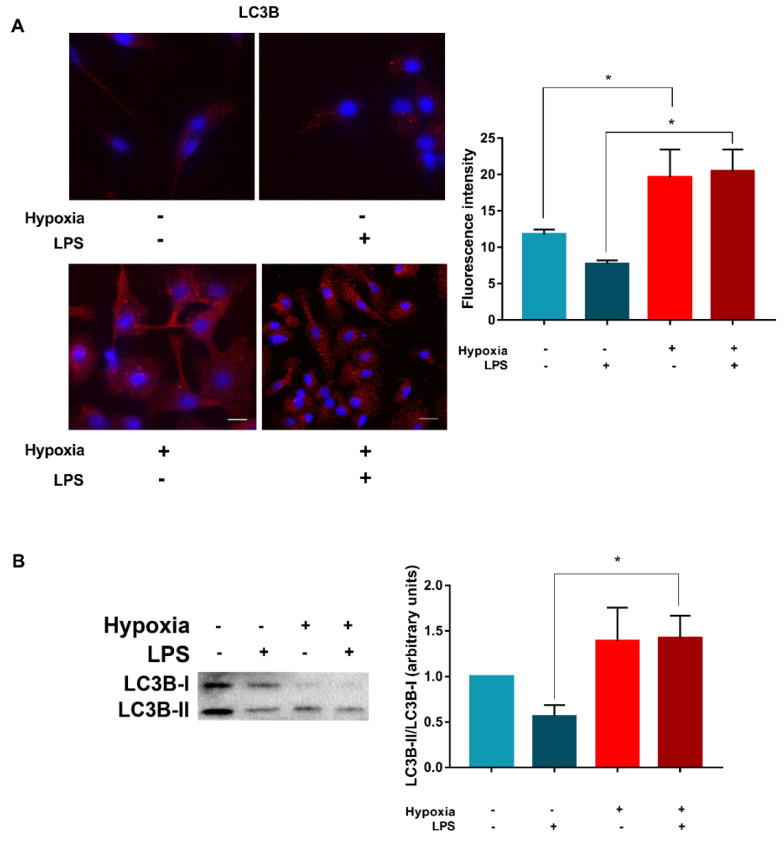
Hypoxia and LPS affects LC3B. (A) LC3B levels after 24 h stimulation without or with LPS and exposure to normoxia and hypoxia, as determined by confocal microscopy analysis (scale bar: 15 µm). (B) LC3I/LC3II conversion by Western blotting. All blots shown are representative of at least three independent experiments and β-actin was used as loading control. Asterisk indicates statistically significant differences (p ≤ 0.05; n = 3).

