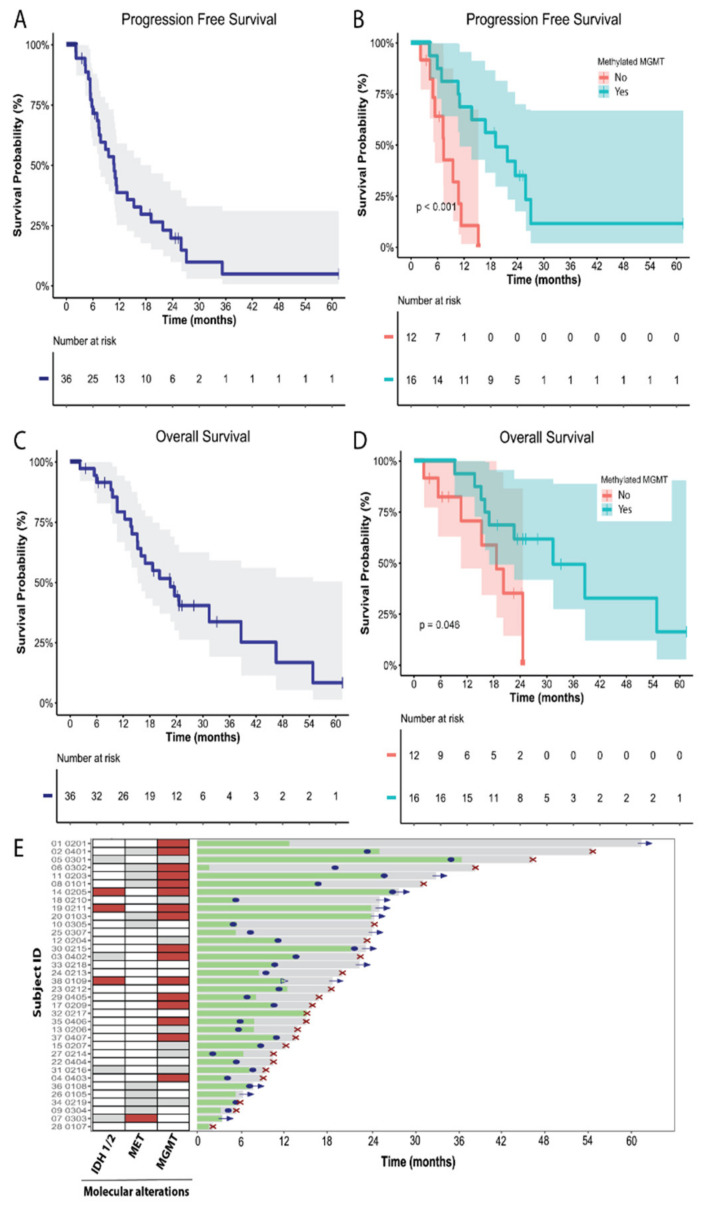
Figure 2.
Crizotinib activity in the evaluable population for efficacy (n = 36 patients). (A) Progression-free survival (PFS) estimated by Kaplan–Meier. (B) PFS estimated by Kaplan–Meier stratified by the MGMT promoter methylation status. (C) Overall survival (OS) estimated by Kaplan–Meier. (D) OS estimated by Kaplan–Meier stratified by the MGMT promoter methylation status. (E) Swimmer plot showing the clinical evolution of each patient. Treatment period (green), follow-up (gray), progression disease (blue dot), exitus (red cross), and patient censored (blue arrow). Patients with presence of molecular alterations (IDH1/2 mutations, MET alterations, or MGMT methylation) are highlighted in red squares in the left panel. White squares indicate presence of WT or native genes. Gray squares on the left panel represent those patients that were not analyzed or not evaluable.

