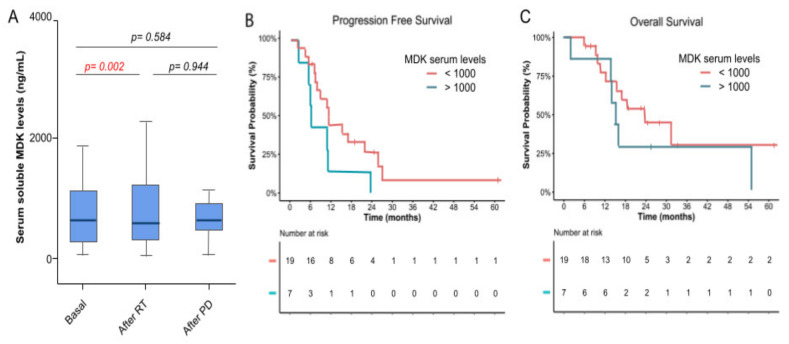
Figure 4.
Correlation between MDK serum levels and efficacy. (A) Soluble MDK serum levels were quantified by ELISA at 3 timepoints throughout the study period: at baseline, after the concomitant phase of treatment, and after unequivocal progression of the disease. MDK levels are represented as a box plot with the median (dark line), the 25% and 75% quartiles (box), and 95% CI interval (cap lines). p-values were obtained by paired t-test. (B) PFS estimated by Kaplan–Meier stratified by the serum MDK levels. (C) OS estimated by Kaplan–Meier stratified by the serum MDK levels.

