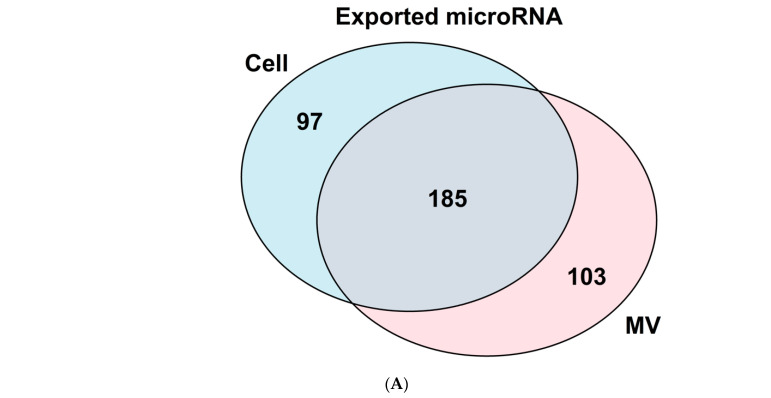
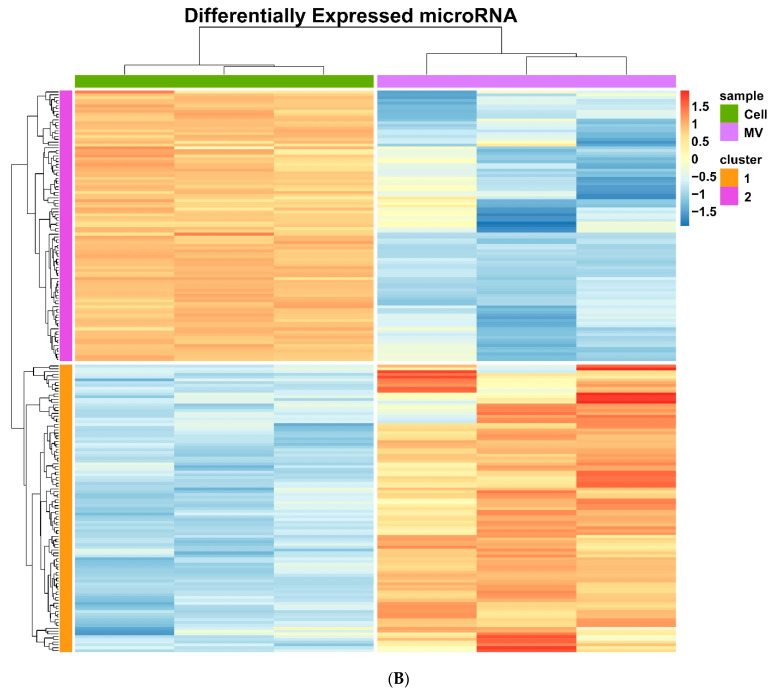
Figure 3.
Examination of chondrocyte and matrix vesicle microRNA populations. (A) Venn diagram comparing differentially expressed (p-value < 0.05 and absolute log 2-fold change > 1) microRNA found in growth zone chondrocytes and matrix vesicles with 97 microRNA found only in the chondrocytes, 103 only in vesicles, and 185 shared between cells and vesicles. (B) Heatmap of the differentially expressed (p-value < 0.05 and absolute log 2-fold change > 1) microRNA from growth zone chondrocytes with cells on the left and matrix vesicles on the right (n = 3).


