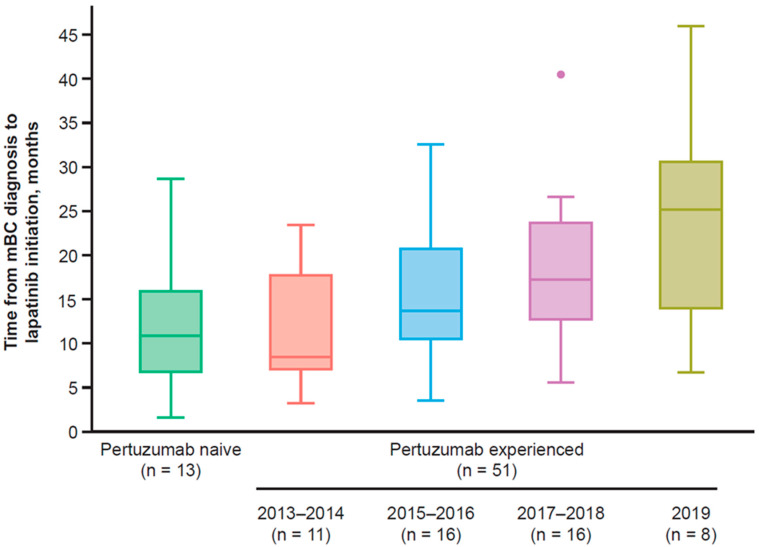
Figure A4.
Time from mBC diagnosis to initiation of lapatinib following 1L trastuzumab. The dots denote outliers, which were calculated per Tukey’s method (Q3 + [1.5 × IQR]). From bottom to top, the bars denote the minimum, Q1, median, Q3, and maximum (once outliers have been removed) values, respectively. IQR = interquartile range; mBC = metastatic breast cancer; Q1 = first quartile; Q3 = third quartile; T-DM1 = trastuzumab emtansine.

