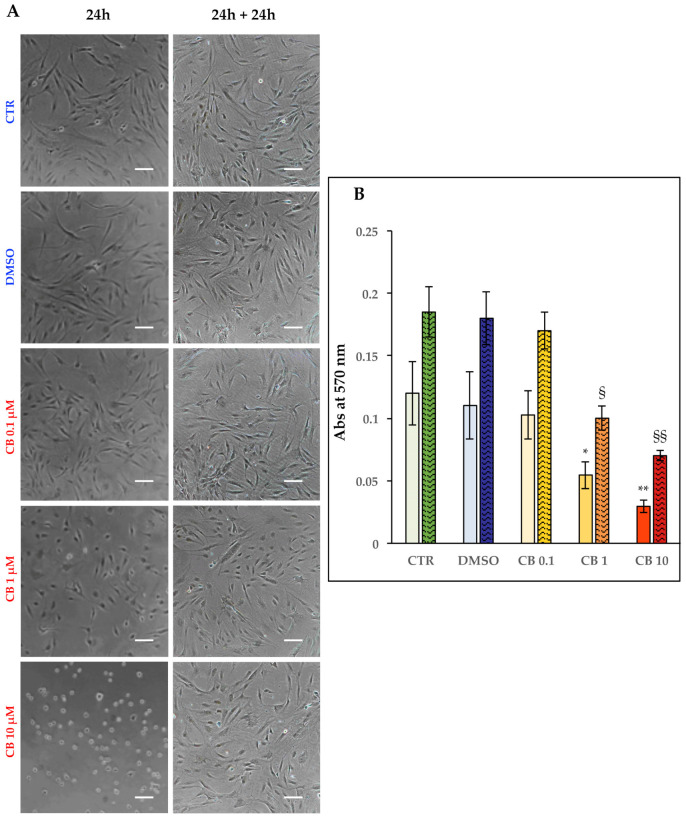
Figure 5.
Morphology and metabolism of human adipose-derived stem cells (hASCs) after 24 h in the presence of different concentrations of cytochalasin B (CB), and after 24 h of recovery time. hASCs were seeded at 4000 cells/cm2 with CB 0.1, 1, and 10 μM, or 0.05% dimethyl sulfoxide (DMSO) (CB vehicle), or without treatment (CTR). (A) Representative images of hASCs at the end of the treatment and 24 h after the end of the treatment. Cells were detected under bright field illumination with a Nikon inverted microscope Eclipse TS100 and a digital sight camera DS-Fi1. Scale bars: 50 μm. (B) Columns related to cell metabolism represent the mean absorbances (Abs) at 570 nm of formazan salts at the investigated time points ± standard deviation (SD); n = 3. For each condition (treated or untreated cells), solid-colored columns refer to cell metabolism at the end of a 24 h treatment, and colored and textured columns refer to a 24 h recovery time. n = 3, * p < 0.05 and ** p < 0.01 vs. CTR cells; § p < 0.05 and §§ p < 0.01 vs. CTR cells 24 h after the chemical wash-out.

