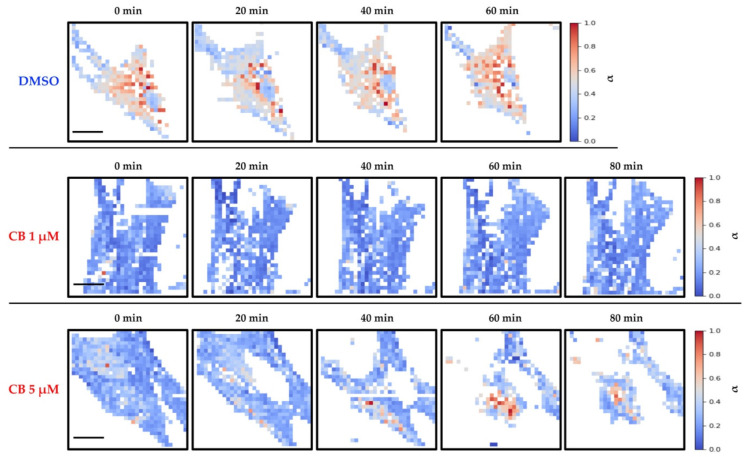
Figure 10.
Evaluation of changes in human adipose-derived stem cells’ (hASCs) viscosity during the treatment with different concentrations of cytochalasin B (CB) using Ting’s model. hASCs were analyzed with the atomic force microscope (AFM) for a total time of about 2 h. Images represent maps of the viscosity parameter α of single cells (seeded in a Petri dish at density of 4000 cells/cm2) at different times treated with 0.05% dimethyl sulfoxide (DMSO) (CB vehicle) or CB at 1 or 5 μM. Each point in a map refers to a specific value of the power-law exponent (α) and refers to a color scale. The color scale is reported on the right of each line. The white regions around the cell represent the substrate. Scale bars: 20 μm.

