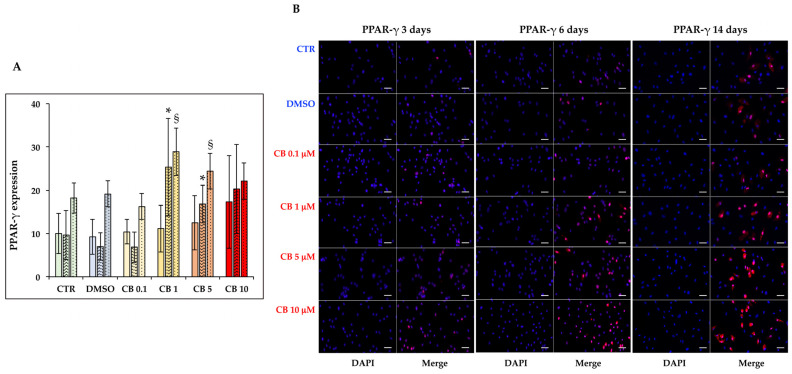
Figure 11.
Immunofluorescence of peroxisome proliferator-activated receptor gamma (PPAR-γ) after 3, 6, and 14 days of induced differentiation in the presence of cytochalasin B. PPAR-γ (red signal) staining was performed in hASC cultures after 3, 6, or 14 days of adipogenic induction in the absence or presence of CB (0.1, 1, 5 and 10 μM) or 0.05% dimethyl sulfoxide (DMSO) (CB vehicle). (A) PPAR-γ expression after 3 (solid-colored columns), 6 (textured, colored columns), and 14 (dotted, colored columns) days of adipogenic differentiation. Graph shows the mean percentages of PPAR-γ positive cells ± standard deviations (SD), n = 3, * p < 0.05 vs. CTR at 6 days; § p < 0.05 vs. CTR at 14 days. (B) Representative images of PPAR-γ (red signal) staining after 3, 6, and 14 days of adipogenic induction. Nuclei were stained with NucBlueTM (DAPI). Acquisitions of images were made with a Nikon inverted microscope Eclipse Ti2-E and a digital sight camera DS-Qi2, through the imaging software NIS-Elements. Scale bars: 50 μm.

