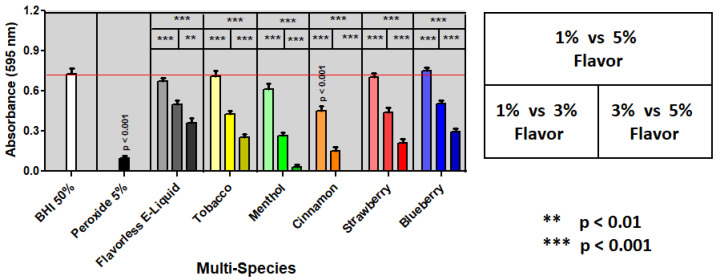
Figure 2.
Dose-Dependent effect of E-liquids on Multi-Species (S. gordonii, S. intermedius, S. mitis and S. oralis) Biofilm Formation. Mixed streptococci (1:1:1:1) biofilms biomass after treatment with 1, 3, and 5% E-liquids ± flavorings in 50% BHI. The given p values indicate significance between BHI 50% (positive control) and 5% peroxide (negative control) or BHI 50% and 1% E-liquid ± flavors using One-Way Anova. The red line indicates the average absorbance of the positive control. The three boxes above each E-liquid ± flavors indicate significance between them using Two-Way Anova. Each bar represents mean ± SE of absorbance (n = 12 to 18).

