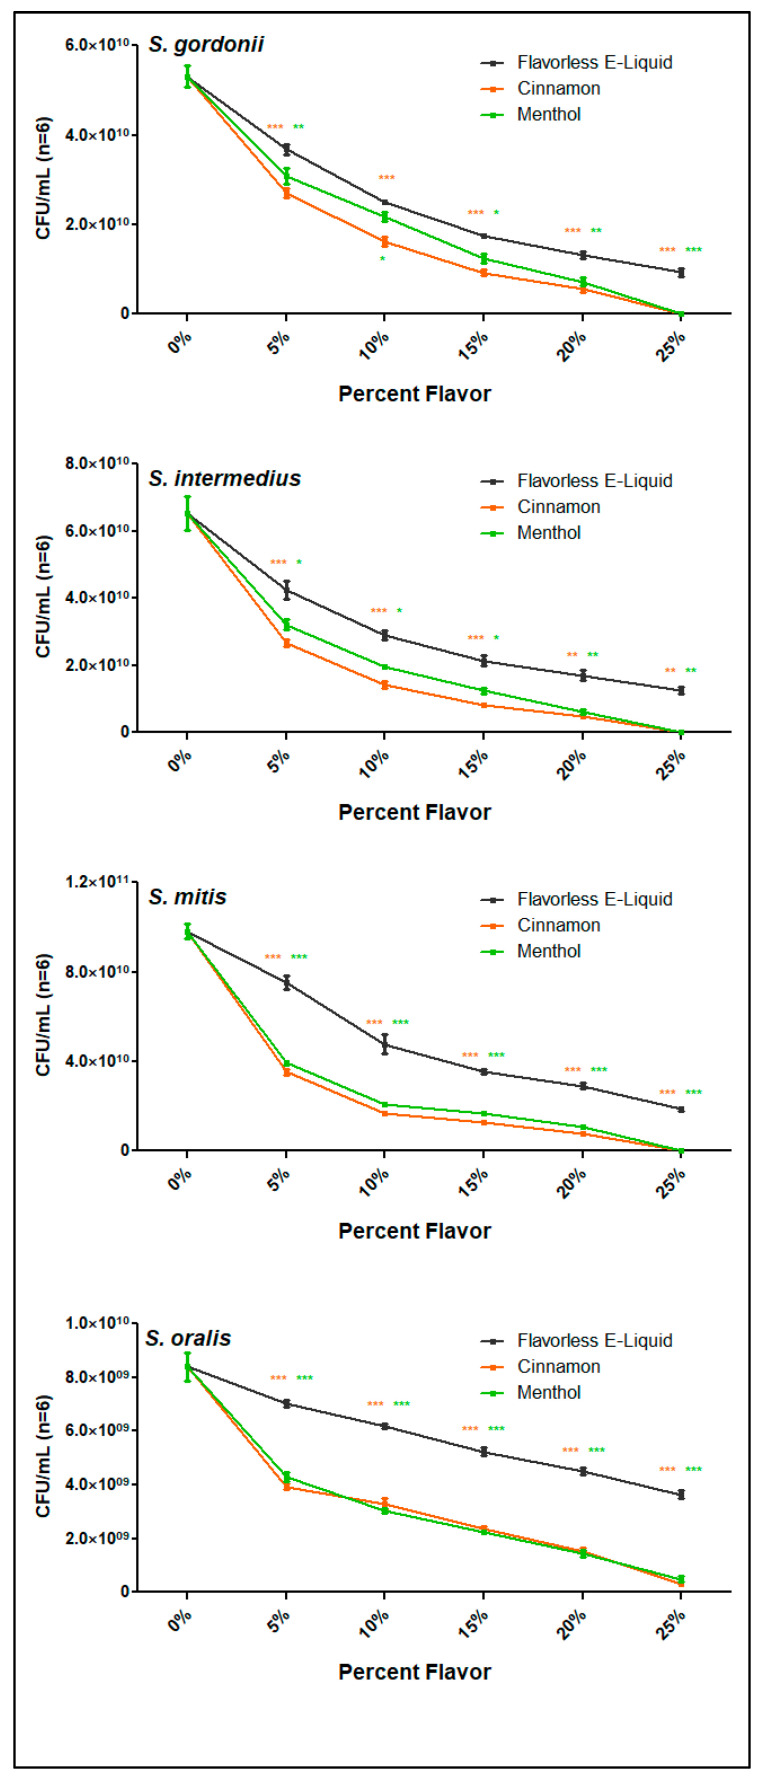
Figure 5.
Death Curves of Streptococci after E-liquid ± menthol or cinnamon. Death curves performed with all four species of streptococci using E-liquid ± flavors from 0 to 25% in PBS. Each data point represents mean ± SEM (n = 6). Green stars and orange stars indicate significance between flavorless E-liquid and menthol and cinnamon, respectively. * p < 0.05, ** p < 0.01 and *** p < 0.001.

