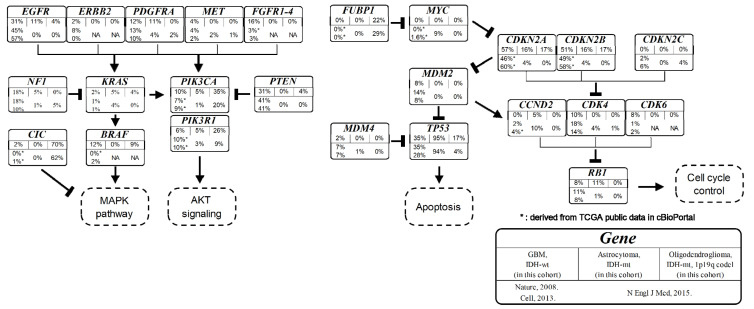
Figure 4.
Results of frequently reported genes in genomic profiling test or next-generation sequencing in glioma. Frequently reported genes are categorized into representative signaling pathways, and their frequency is illustrated in each box entitled to the gene. In each box, (I) the top row indicates the name of the gene; (II) the middle row indicates the frequency of genomic aberrations in our cohort for the selected histological classification groups, such as IDH-wt glioblastoma, IDH-mt astrocytoma, and oligodendroglioma IDH-mt 1p19q co-deleted; (III) the bottom row indicates the reference study. (*): missing data in the original reference, and the corresponding frequency is derived manually from cBioPortal (https://www.cbioportal.org/, accessed on 1 February 2022). Nature, 2008 (reference [20]): Cell, 2013 (reference [21]), N. Engl. J. Med., 2015 (reference [19]).

