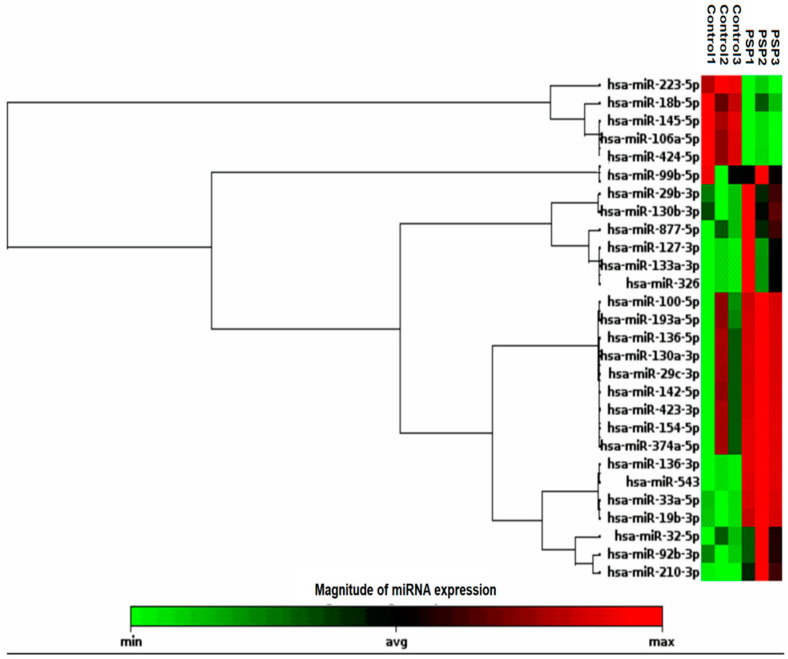
Figure 2.
Heat map and unsupervised hierarchical clustering of plasma miRNA profiles in the study groups: The unsupervised hierarchical clustering was performed for both the control and PSP groups, and the top 28 differentially expressed miRNAs were presented in the heat map. The color scale, ranging from green to red, indicated low to high expression of each miRNA transcript.

