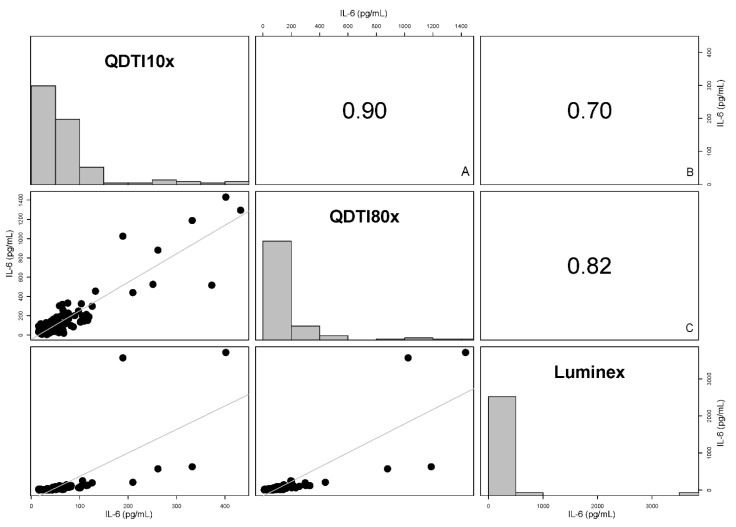
Figure 3.
Scatter plot matrix displaying associations between IL-6 concentrations between QDTI instrument and Luminex assay. High correlations were observed between the IL-6 concentrations (A) between QDTI10x and QDTI80x (r = 0.90, p-value < 0.001) and (B) between the Luminex and QDTI10x (r = 0.70, p-value < 0.001) and (C) between the Luminex and QDTI80x (r = 0.82, p-value < 0.001).

