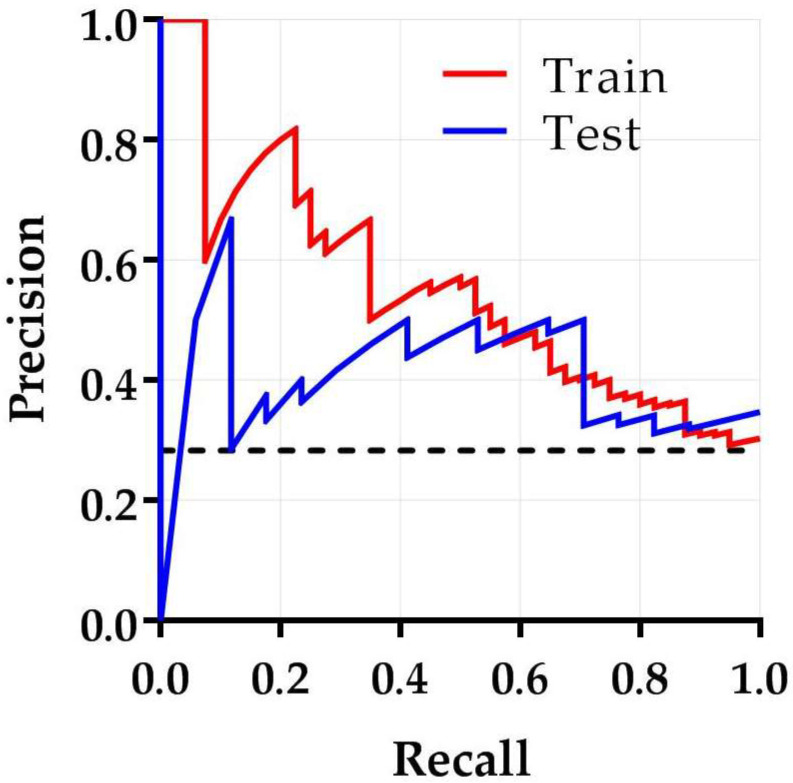
Figure 5.
Precision–recall curve of the best performing model demonstrating the trade-off between precision and recall. The area under the precision–recall curve is reflected by the average precision. The average precisions for the training and test subset are 0.47 and 0.66, respectively. The black dashed line is the score of a random classification (0.28).

