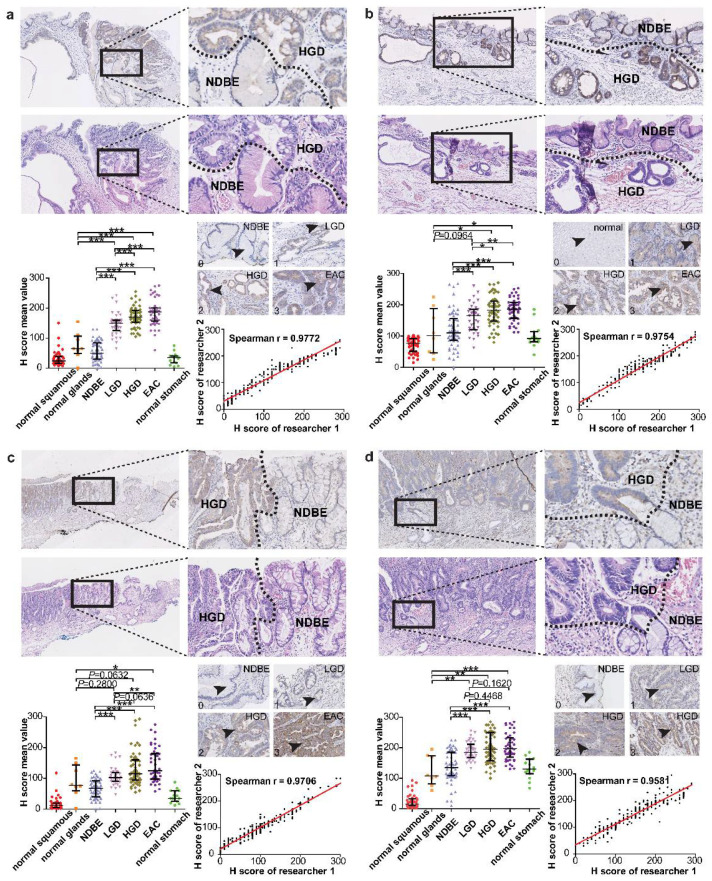
Figure 1.
Immunohistochemistry results of SULF1, DDR1, PKCι, and SPARC. Representative images and statistics of SULF1 (a), DDR1 (b), PKCι (c), SPARC (d) are shown. In each section, the upper panel depicts the IHC images in low and high magnification, accompanied by H&E staining results in serial cutting slices and pathological delineation. The left lower panel shows the comparison of the mean H-score in seven groups: normal squamous epithelium, normal glands, NDBE, LGD, HGD, EAC, and normal stomach. Two researchers performed H-scoring separately and blindly. The mean H-score is the average value of the H-scores of researcher I and researcher II. The middle right panel explains how we defined the staining intensity of 0 to 3. No IHC positive staining is scored as 0. Weak IHC positive staining is scored as 1. Moderate IHC positive staining is scored as 2. Strong IHC positive staining is scored as 3. The lower right panel shows the correlation analysis of H-scoring by researcher I and researcher II, with Spearman correlation. EAC: esophageal adenocarcinoma; HGD: high-grade dysplasia; LGD: low-grade dysplasia; NDBE: non-dysplastic Barrett’s esophagus. * p value < 0.01; ** p value < 0.001; *** p value < 0.0001.

