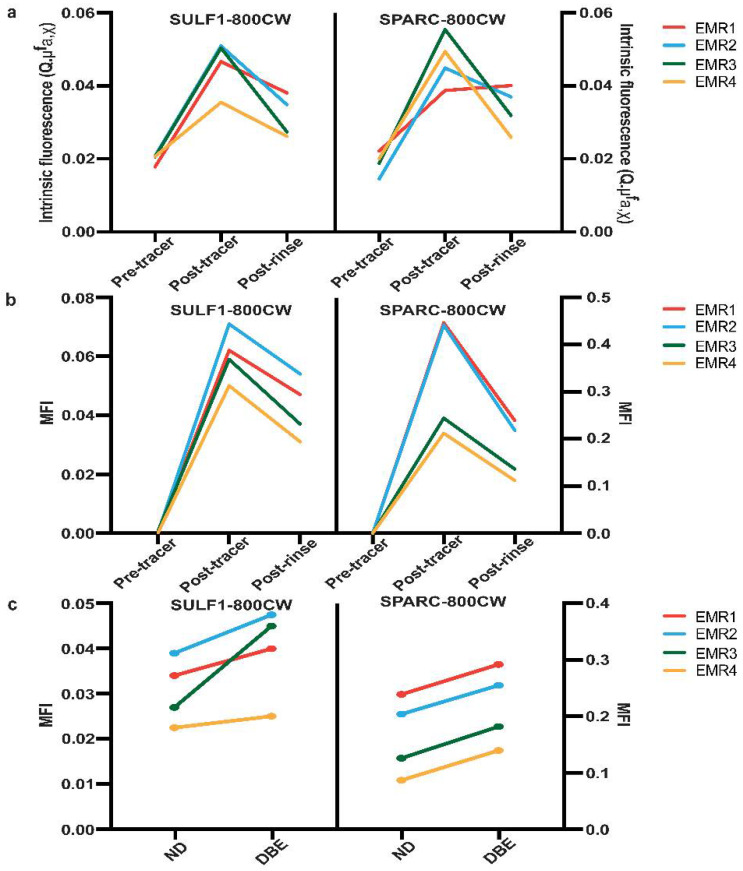
Figure 4.
The fluorescence intensity analysis of SULF1-800CW and SPARC-800CW on EMR specimens. (a) The quantified intrinsic fluorescence with MDSFR/SFF spectroscopy of SULF1-800CW (left) and SPARC-800CW (right) before tracer spraying (pre-tracer), after tracer spraying, and before rinsing (post-tracer) and after rinsing (post-rinse). (b) The mean fluorescence intensity (MFI) of SULF1-800CW (left) and SPARC-800CW (right) before tracer spraying (pre-tracer), after tracer spraying before rinsing (post-tracer), after rinsing (post-rinse). (c) The MFI of dysplastic BE (DBE) tissue compared to non-dysplastic (ND) tissue. Each line connects paired data from the same specimen. DBE: dysplastic Barrett’s esophagus; EMR: endoscopic mucosal resection; MFI: mean fluorescence intensity; NDBE: non-dysplastic Barrett’s esophagus.

