Figure 3.
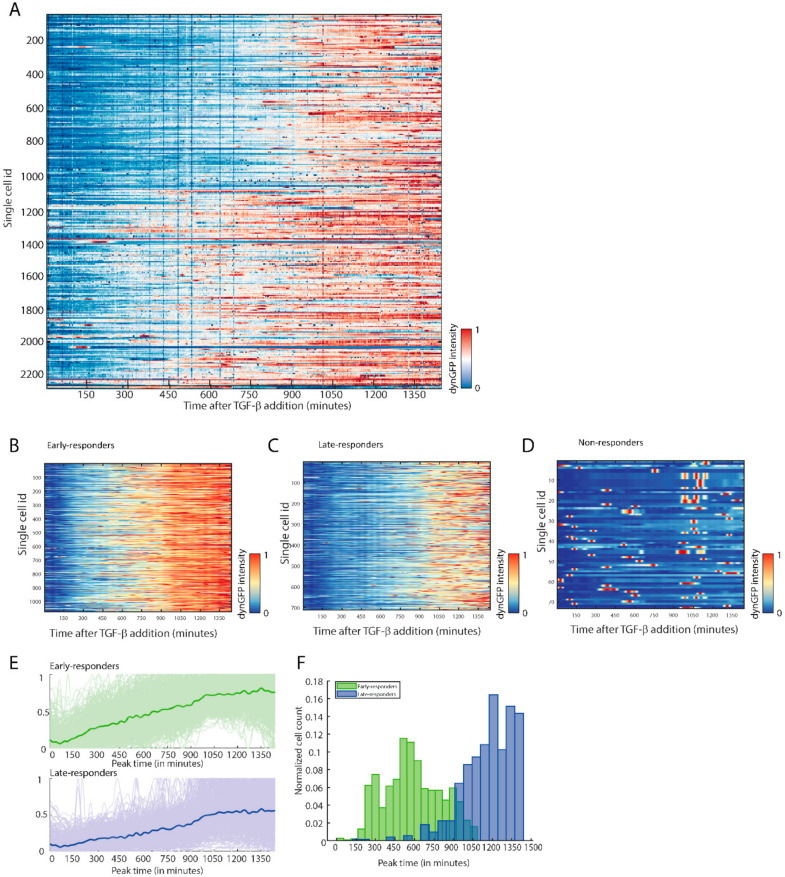
The TGF-β/SMAD3 dynGFP reporter can be used to identify heterogenous TGF-β/SMAD3 responses on a single cell level. (A) Heatmap showing the increase of relative dynGFP intensity between 0 (blue) and 1 (red) of live cell imaging for 24 h of individual B16F10 melanoma cells stably expressing CAGA12-dynGFP (Clone 7 population). Cells were stimulated with TGF-β1 (1 ng/mL) during the 24 h of imaging. (B–D) The dynamic TGF-β/SMAD3 dynGFP response in B16F10 cells can be divided into three distinct clusters: early responders (B), late responders (C), and non-responders (D). (E) Early TGF-β/SMAD3 dynGFP responders show an increase and plateau in dynGFP signal earlier after TGF-β stimulation compared to late responders. (F) Histogram plot reveals that the timing of the peak in dynGFP signal after TGF-β stimulation differs between early and late responders.

