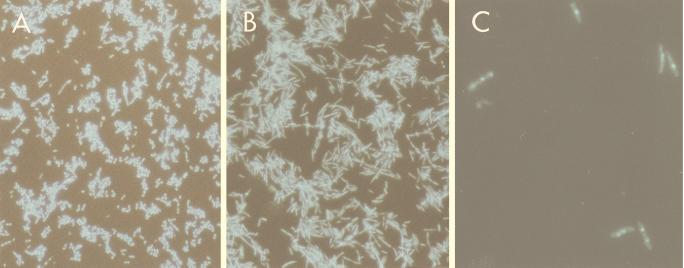
FIG. 4.
Morphology of quiescent cells. DS941hns-205 (control) and DS941hns-205 pCm(ss)-19 cells were cultured at 42°C (inducing conditions when expressing Rcd). Cells were stained with DAPI and visualized by using fluorescent light microscopy. (A) DS941hns-205 (OD600 = 0.316). (B) DS941hns-205 pCm(ss)-19 6 h after transfer to 42°C (OD600 = 0.258). Magnification (A and B), ×400. (C) DS941hns-205 pCm(ss)-19 4 h after transfer to 42°C (OD600 = 0.244). Magnification, ×1,000.

