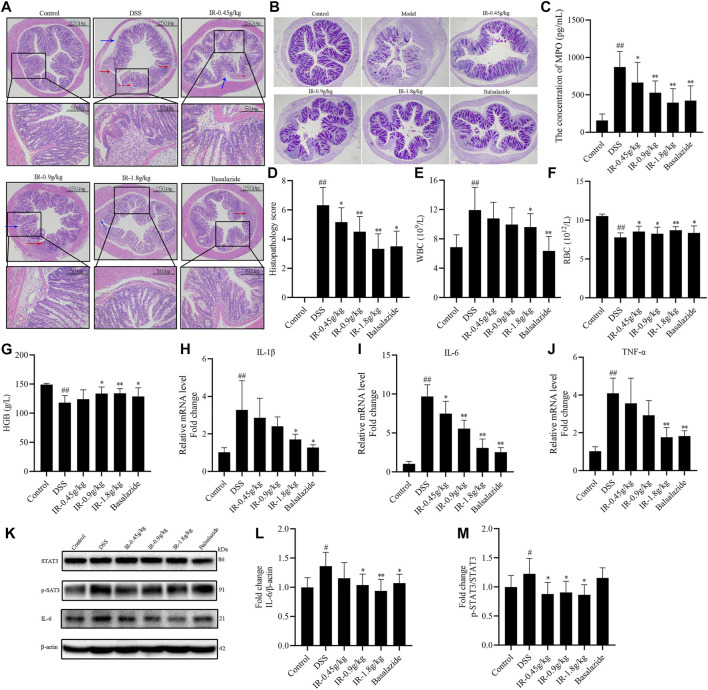
FIGURE 3.
IR suppress inflammation of UC mice. (A) Representative H & E staining colon tissue of mice (day 56). (B) PAS staining colon tissue of mice (day 56). (C) MPO content was measured by ELISA in serum of mice. (D) Histopathology scores. (E) The number of WBC in each group of mice tested by routine analysis of blood. (F) The number of RBC in each group of mice. (G) The concentration of HGB in each group of mice tested by routine analysis of blood. (H–J) The mRNA levels of IL-1β, IL-6, and TNF-α from the colon of mice. (K) The protein levels of STAT3, p-STAT3, and IL-6 in colon detected by western blotting. (L) The gray intensity analysis of IL-6. (M) The gray intensity analysis of p-STAT3/STAT3. All data were compared using one-way ANOVA, and p-values reflected differences between experimental groups.

