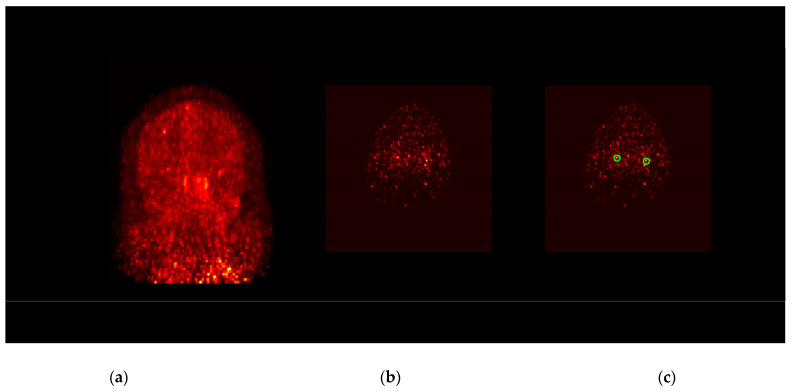
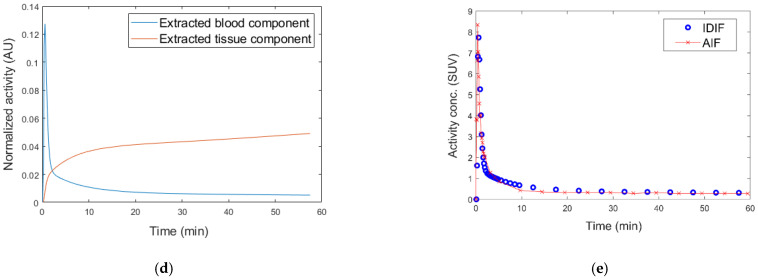
Figure 1.
Demonstration of the IDIF extraction. (a) The coronal maximum intensity projection (MIP) of the summed early frames of the DPA-714 scan of one subject. (b) One axial slice of the neck area at the early frame. (c) The segmented regions (green contour) for carotid artery over the same slice. (d) The MBMF-extracted time-activity curves for the blood and tissue components. Note both curves are in the normalized and dimensionless form. (e) The resultant IDIF (blue circle) after the magnitude is re-scaled by the proposed method. The activities measured with arterial blood sampling are plotted as red stars, showing a satisfactory agreement between AIF and IDIF.


