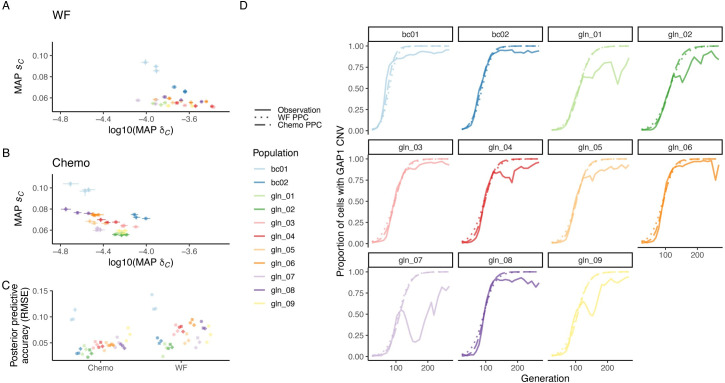
Fig 6. Inference of CNV formation rate and fitness effect from empirical evolutionary dynamics.
The inferred MAP estimate and 95% HDIs for fitness effect sC and formation rate δC, using the (A) WF or (B) chemostat (Chemo) model and NPE for each experimental population from [48]. Inference performed with data up to generation 116, and each training set (marker shape) corresponds to an independent amortized posterior distribution estimated with 100,000 simulations. (C) Mean and 95% confidence interval for RMSE of 50 posterior predictions compared to empirical observations up to generation 116. (D) Proportion of the population with a GAP1 CNV in the experimental observations (solid lines) and in posterior predictions using the MAP estimate from one of the training sets shown in panels A and B with either the WF (dotted line) or chemostat (dashed line) model. Formation rate and fitness effect of other beneficial mutations set to 10−5 and 10−3, respectively. Data and code required to generate this figure can be found at https://doi.org/10.17605/OSF.IO/E9D5X. CNV, copy number variant; HDI, highest density interval; MAP, maximum a posteriori; NPE, Neural Posterior Estimation; RMSE, root mean square error; WF, Wright–Fisher.

