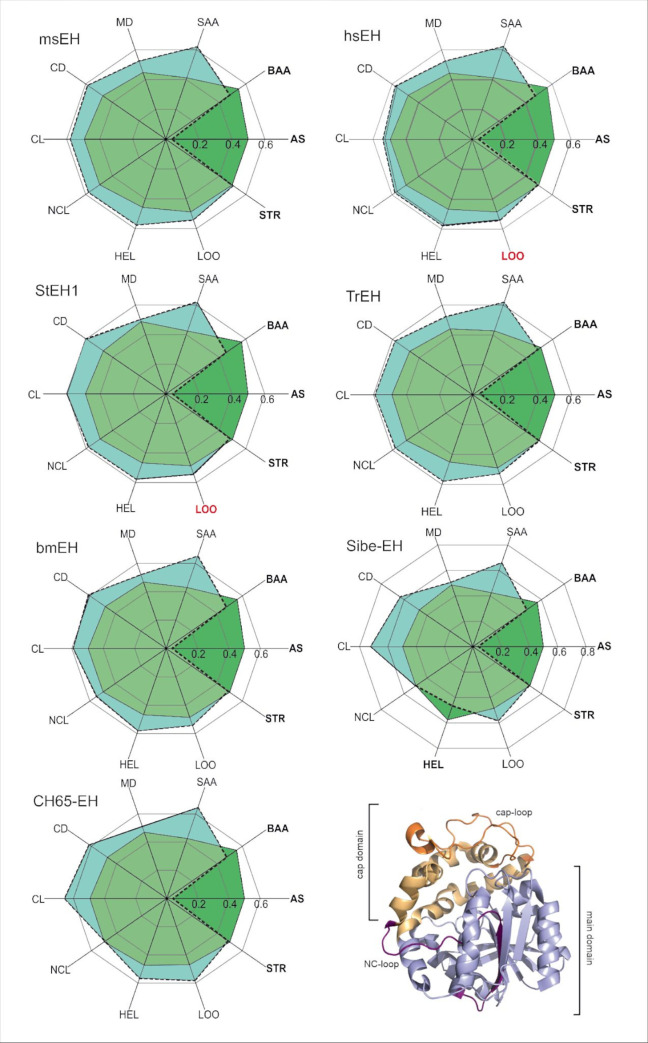
Fig 1. Radial plot of the median entropy values of referential compartments (green) and the remaining positions of the trimmed MSA (turquoise).
When the median entropy values of the components cover the median entropy values of the trimmed MSA, it means that the particular compartment is more conserved than the remaining positions of the MSA (dark green). The compartments considered as conserved are written in bold. The MSA contained 1455 sequences and 419 positions. Figure represents data shown in S2 Table. All pairwise differences (except for loops (LOO) in hsEH and StEH1, marked red) are statistically significant (Epps-Singleton test). In the bottom right corner, a schematic representation of the analysed structure-specific comportments is provided. Abbreviations: AS–active site; BAA–buried amino acids; SAA–surface amino acids; MD–main domain; CD–cap domain; CL–cap-loop; NCL–NC-loop; HEL–helices; LOO–loops; STR–strands.

