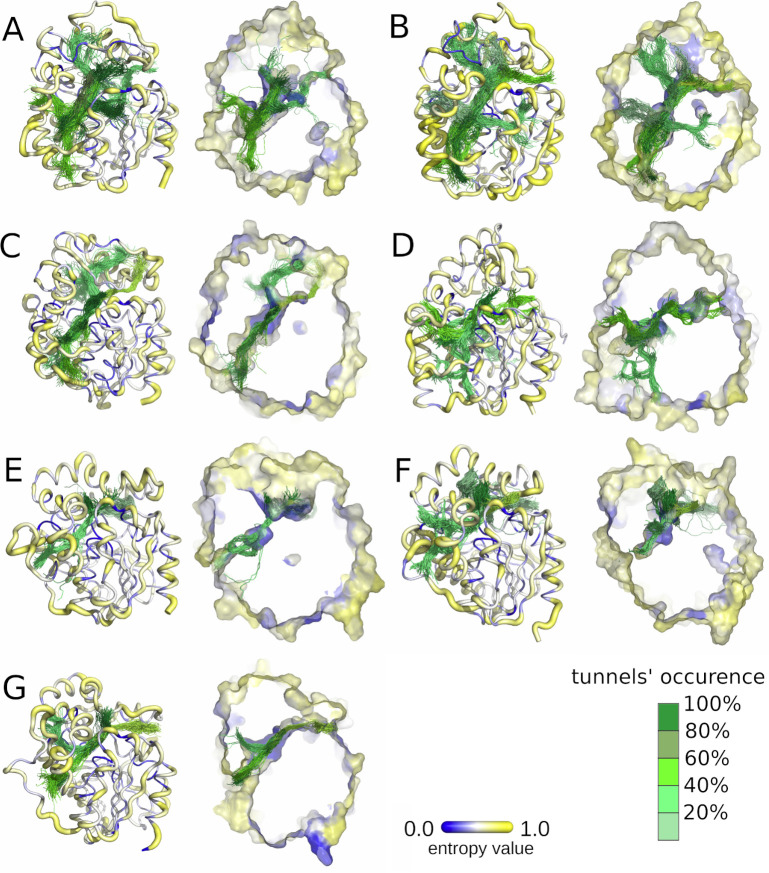
Fig 3.
Visualisation of the entropy score of each protein residue (right), and frequency of tunnels identified with CAVER during molecular dynamics (MD) simulations (left) for each system: A) M. musculus soluble epoxide hydrolase (msEH), B) H. sapiens soluble epoxide hydrolase (hsEH), C) S. tuberosum soluble epoxide hydrolase (StEH1), D) T. reesei soluble epoxide hydrolase (TrEH), E) B. megaterium soluble epoxide hydrolase (bmEH), and thermophilic soluble epoxide hydrolases from an unknown source organism F) Sibe-EH, and G) CH65-EH. Protein residues are shown according to their entropy score: low values of entropy are marked as thin blue lines and higher values as thick yellow lines. Tunnel centerlines are coloured according to the frequency of their occurrence during MD simulations (the tunnels occurrence was calculated based on the numbers of the MD simulation frames in which the tunnel was identified; 100% means that the tunnel remained open in all 50,000 MD simulation frames): dark green indicates the most frequently identified tunnels, and light green those very rarely identified. The right side of each pair shows cross-sections of protein surfaces coloured according to the entropy score of each amino acid residue.

