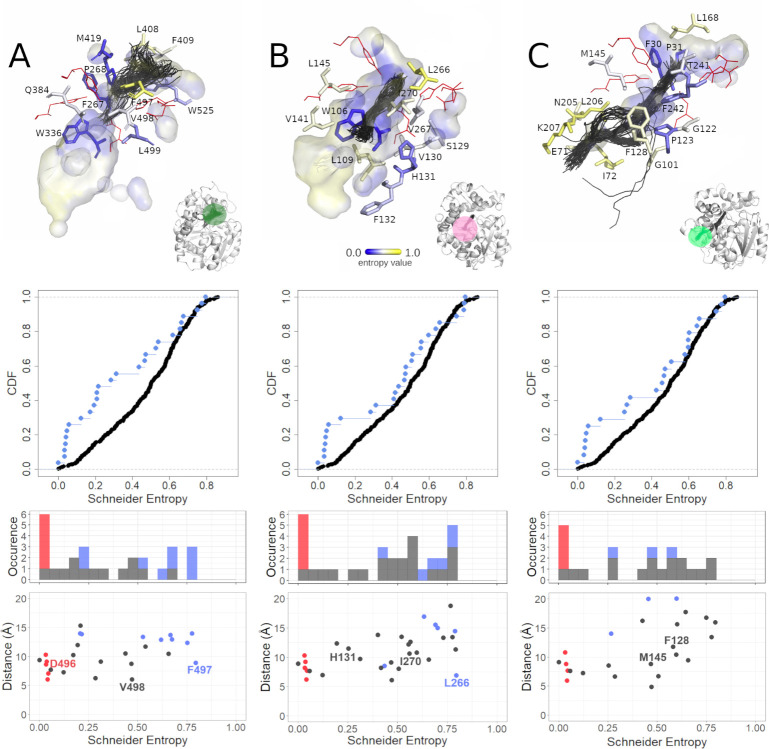
Fig 5. Analysis of the selected tunnels of soluble epoxide hydrolases (sEHs).
A) The Tc/m tunnel of the H. sapiens soluble epoxide hydrolase (hsEH) structure, B) the Tm1 tunnel of the S. tuberosum soluble epoxide hydrolase (StEH1) structure, and C) the Tc/m_back tunnel of the B. megaterium soluble epoxide hydrolase (bmEH). Each panel consists of three parts: top section—close-up of tunnel residues. Residues are coloured according to entropy score. For the sake of clarity, less-frequently detected amino acid residues were omitted, and those creating the active site are shown as red lines. The active site cavity is shown as the interior surface, and the representative tunnel detected during molecular dynamics (MD) simulations as centerlines; middle section—cumulative distribution function (CDF) of entropy score for the tunnel-lining residues without the surface residues (cyan dots) and corresponding counterpart (black dots); and bottom section–scatterplot of the tunnel residues’ entropy values relative to distance from the geometric centre of the α carbons of the enzyme, along with a marginal histogram of entropy value counts in respective intervals. Scatterplot points as well as histogram counts grouped into classes based on residue classification (active site–red; surface residues–blue; buried–grey).

