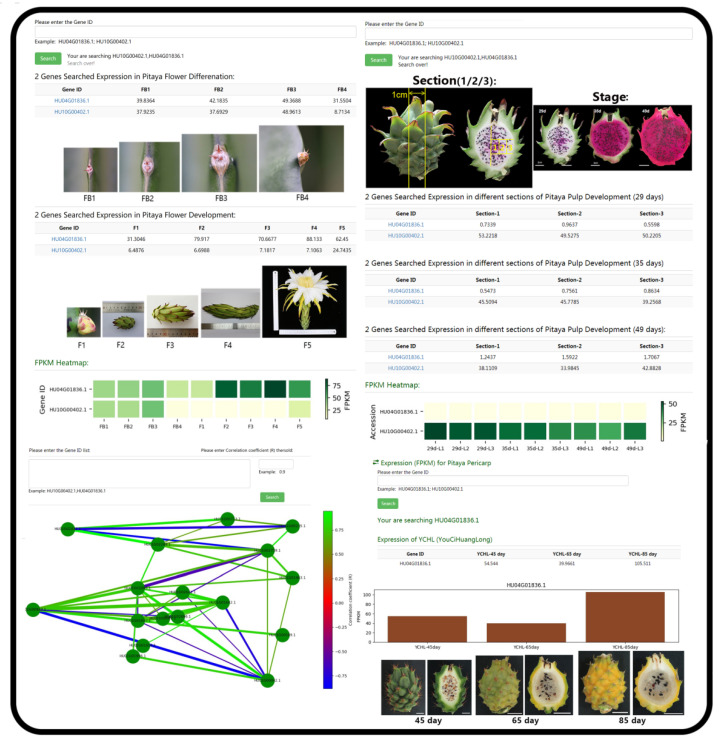
Figure 5.
The screenshots of representative resources and action page example for the ‘Expression’ module. ‘Expression’ module displayed the gene expression data of each tissue in various development stages through the expression calorimetry, histogram and corresponding table forms. Users can input lists of gene symbols and gain the coexpression relationship and visual network diagram through the algorithm based on Pearson correlation coefficient in coexpression function of ‘Expression’ module.

