Figure 1.
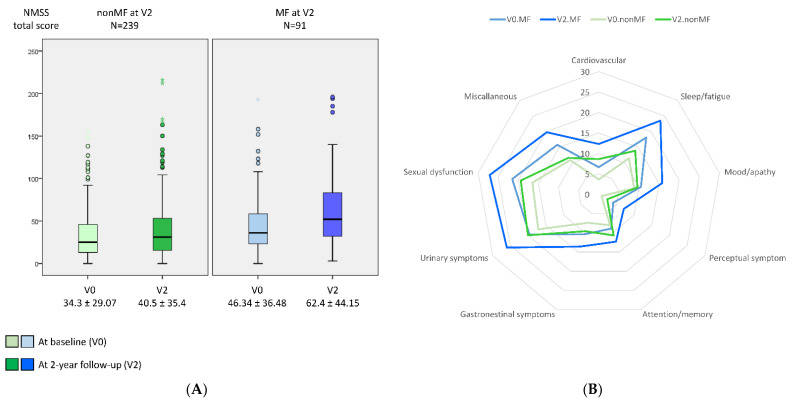
(A) NMSS total score (y-axis) at baseline (V0) and after a 2-year follow-up (V2) in PD patients who developed MF at V2 (MF at V2 (PD-MFV2); N = 91) and those patients who did not develop MF at V2 (nonMF at V2 (PD-nonMFV2); N = 239). NMSS total score at V0, PD-MFV2 vs. PD-nonMFV2, p = 0.001; NMSS total score at V2, PD-MFV2 vs. PD-nonMFV2, p < 0.0001; change in the NMSS total score from V0 to V2 in PD-MFV2, p < 0.0001; change in the NMSS total score from V0 to V2 in PD-nonMFV2, p < 0.0001; comparison between the change in the NMSS total score from V0 to V2 in PD-MFV2 vs. PD-nonMFV2, p = 0.021. Data are presented as box plots, with the box representing the median and the two middle quartiles (25–75%). (B) Mean score on each domain of the NMSS at V0 and at V2 in both groups, PD-MFV2 and PD-nonMFV2. At V0, the difference was significant between both groups in NMSS-1 (Cardiovascular) (p = 0.001), NMSS-2 (Sleep/fatigue) (p = 0.001), NMSS-4 (Perceptual symptoms) (p < 0.0001), and NMSS-9 (Miscellaneous) (p = 0.005). At V2, the difference was significant between both groups in all domains (p values from 0.024 to <0.0001) except in NMSS-5 (Attention/memory) (p = 0.364). p values were computed using the Kolmogorov–Smirnov, Mann–Whitney, and Wilcoxon tests. Mild outliers (O) are data points that are more extreme than Q1 − 1.5 * IQR or Q3 + 1.5 * IQR.

