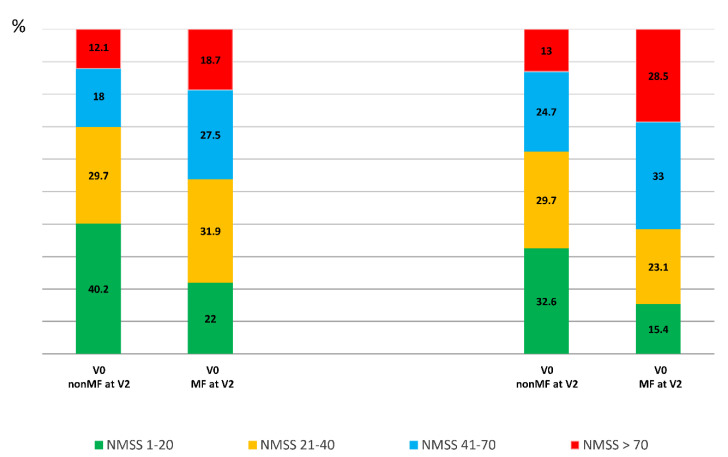
Figure 2.
Frequency of patients with mild (NMSS 1–20), moderate (NMSS 21–40), severe (NMSS 41–70), and very severe (NMSS > 70) NMS burden at V0 and at V2 considering two groups: patients who developed MF at V2 (MF at V2 (PD-MFV2); N = 91) and those who did not developed MF at V2 (nonMF at V2 (PD-nonMFV2); N = 239). PD-nonMFV2 vs. PD-MFV2 at V0, p = 0.011; PD-nonMFV2 vs. PD-MFV2 at V2, p < 0.0001; change in PD-nonMFV2 from V0 to V2, p = 0.003; change in PD-MFV2 from V0 to V2, p = 0.001. p values were computed using the Chi-square and marginal homogeneity test.

