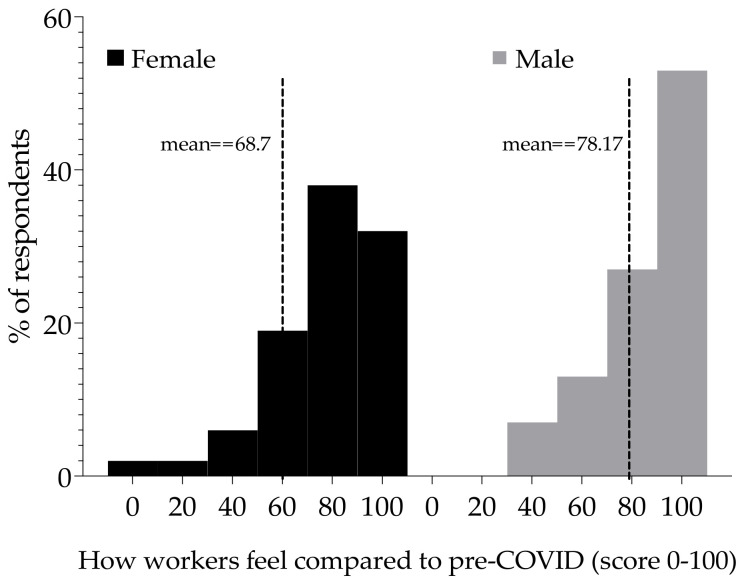
Figure 2.
Health scores for respondents post-acute COVID-19 symptoms. Distribution of health scores (0–100) for female respondents (n = 47) and male (n = 15). Zero (0) to mean worst health and 100 best health. The separated (grouped) bars show the percentage of respondents that reported the scores. The vertical dashed lines indicate the mean scores for each distribution.

