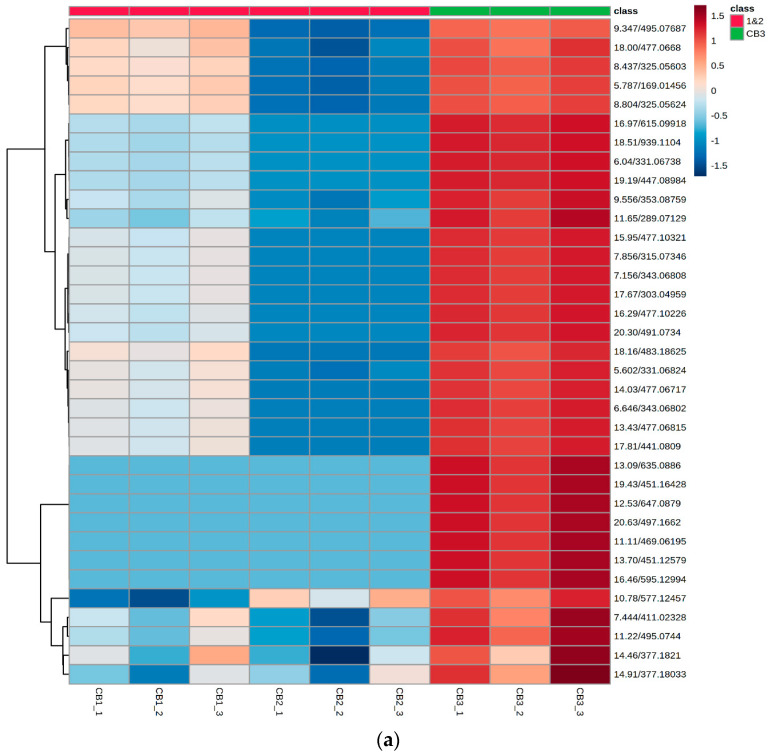
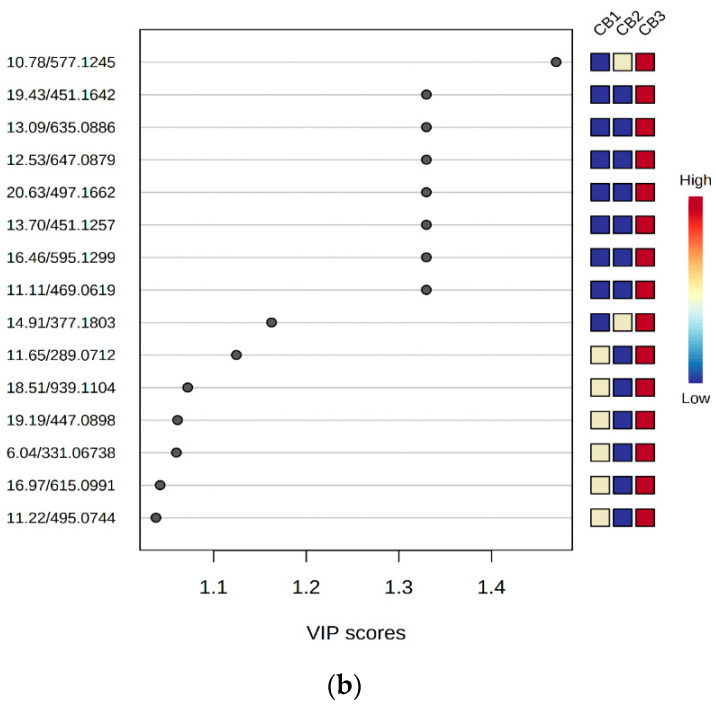
Figure 6.
(a): Heat map of S. molle Seeds + Husks (CB1), Dehulled Seeds (CB2), and Husks (CB3) secondary metabolites analysed via UPLC-QTOF-MS. The numbers on the right represent the RT and m/z [M-H]− shown on Table 1. (b): Heat map of S. molle Seeds + Husks (CB1), Dehulled Seeds (CB2), and Husks (CB3) secondary metabolites analysed via UPLC-QTOF-MS.


