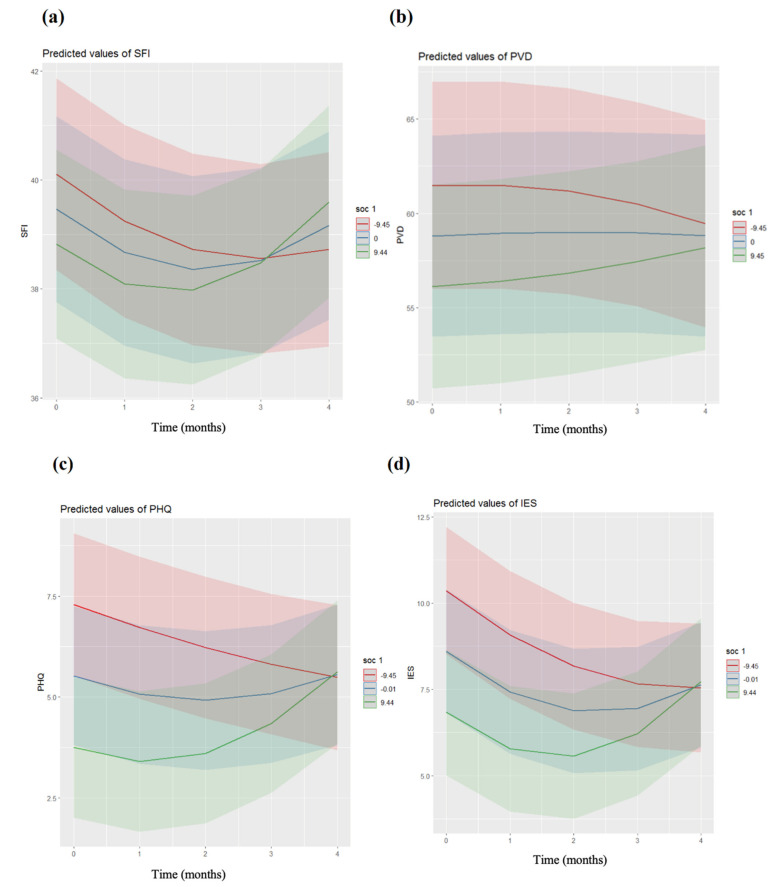
Figure 2.
Trajectories of the mental health of the healthcare professionals across the measurement points for their Work-SOC levels (red, –1SD; blue, mean; green, +1SD). Slopes of COVID-19-related anxiety (a), perceived vulnerability (b), depressiveness (c), and psychological trauma symptomatology (d), all by Work-SOC levels. The shaded areas correspond to the confidence intervals of each trajectory. Number −9.45 = −1SD (lower Work-SoC), +9.45 = +1SD (higher Work-SoC). Time points: T0, April 2020; T1, July 2020; T2, October 2020; T3, January 2021; T4, April 2021. m-SFI, modified Swine Influenza Anxiety Index; PVD, Perceived Vulnerability to Disease Scale; PHQ, Patient Health Questionnaire; IES, Impact of Event Scale; Work-SoC, Work-related Sense of Coherence Scale. Colour-shaded areas represent the SD. The figures were directly plotted by R package.

