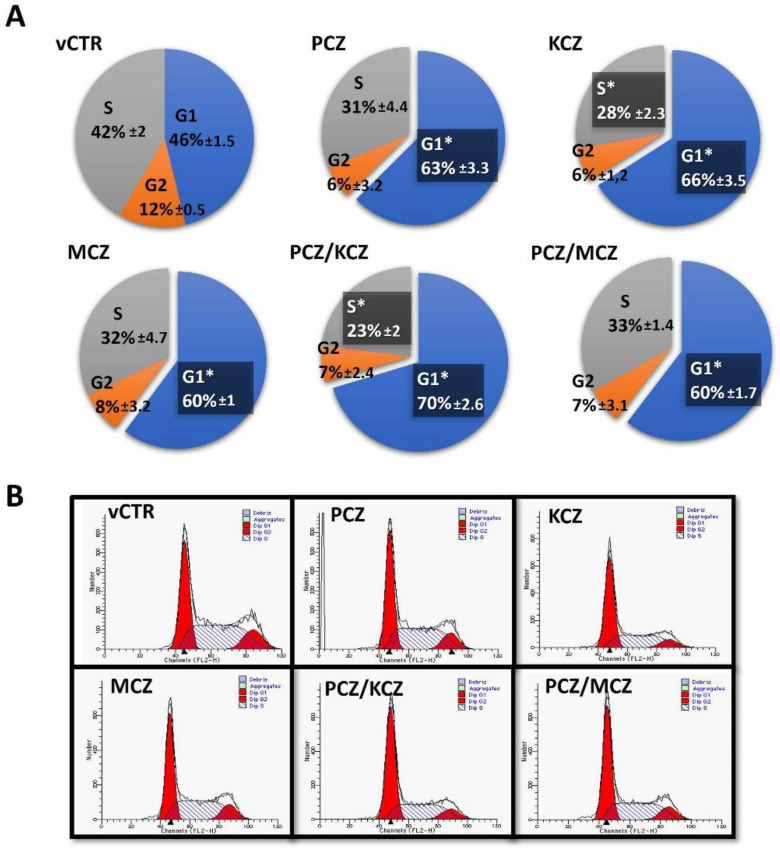
Figure 3.
Effects of azole exposure on the distribution of cell cycle phases in TM4 cells. Cells were treated with PCZ (18.3 µM), KCZ (18.6 µM), MCZ (8.6 µM), and their mixtures for 48 h, and compared to the vCTR. The distribution of cell cycle phases was assayed using PI staining and flow cytometry analyses. The percentage of cells in each phase is presented at 48 h of incubation (A), and represents the mean ± SE of three independent experiments; one-way ANOVA followed by Dunnett’s test; * p < 0.05 compared to the vCTR. (B) Representative images of flow cytometric profiles after 48 h of incubation in the absence (vCTR) or in the presence of azoles.

