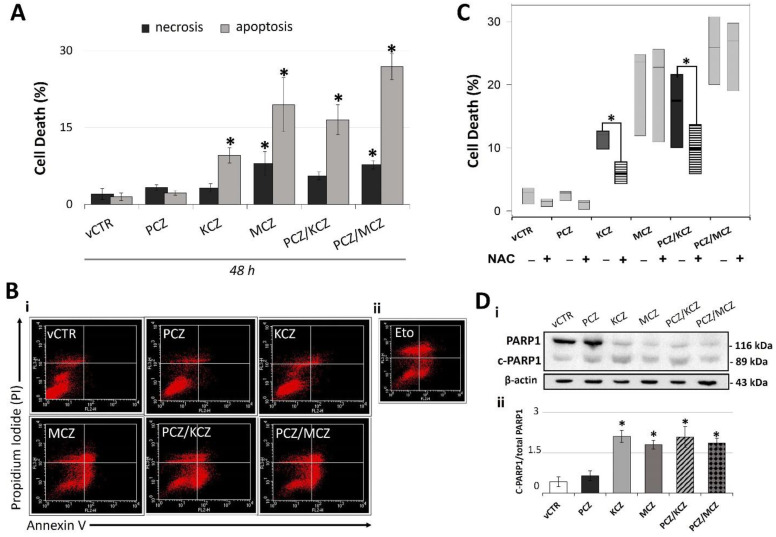
Figure 4.
Possible ROS-dependent apoptotic activity of azole drugs in TM4 cells. (A) Graph representing the percentage of apoptotic and necrotic cells in experimental groups exposed for 48 h to PCZ, KCZ, MCZ, and mixtures. Data from three independent experiments are expressed as mean ± SE; one-way ANOVA followed by Dunnett’s test; * p < 0.05 vs. vCTR. (B,i) Representative images of cytofluorometric profiles of cells stained with annexin V and PI after 48 h of incubation in the absence (vCTR) or in the presence of azoles. (B,ii) Cells treated with 25 µM etoposide (Eto) for 24 h were used as a positive control for apoptosis induction. Upper left quadrant = necrosis; upper right quadrant = late apoptosis; lower right quadrant = early apoptosis. (C) Analysis of cell death (%) in samples treated or not treated (vCTR) with azoles at 48 h of incubation, in the presence (+) or in the absence (−) of the inhibitor of ROS (1 mM NAC). NAC = N-acetyl-cysteine. Values are expressed as the mean of three independent experiments ± SE; one-way ANOVA, Dunnett’s test; * p < 0.05 vs. vCTR. (D,i) Representative images of C-PARP1 Western blotting and (D,ii) protein expression levels of C-PARP1 (89 kDa) at 48 h exposure to azoles. Band density was performed by using Image-J software. The bar graph represents data from three independent experiments as ratios of cleaved PARP1 to total PARP1 ± SE; ß-actin was used as loading control. one-way ANOVA, followed by Holm–Sidak method; * p < 0.05 vs. vCTR.

