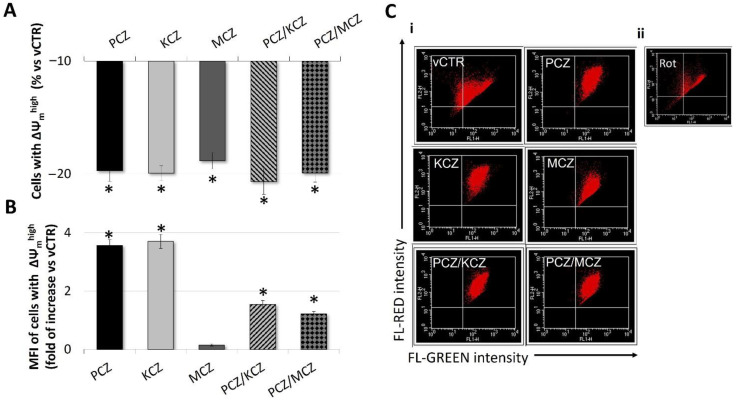
Figure 6.
Depolarising effect of azole compounds on mitochondrial membrane potential (ΔΨm) in TM4 cells. ΔΨm was measured by FACS using JC-1 (3 µM) staining. (A,B) Effect of azole fungicides on mitochondrial membrane potential in selected TM4 cells with ΔΨmhigh, expressed as (A) the percentage of cells with ΔΨmhigh (red/orange fluorescence of JC-1 aggregates) and (B) MFI emitted by ΔΨmhigh populations in vCTR and azole-exposed groups (3 h). Values from three independent experiments are expressed as mean ± SE. One-way ANOVA followed by Dunnett’s test; * p < 0.05. (C,i) Representative images of flow cytometry profiles of JC-1-stained samples analysed at 3 h of incubation for vCTR and azole-exposed groups. (C,ii) Cells were incubated with 25 mM rotenone for 1 h as a positive control for the abolishment of ΔΨm. MFI = mean red fluorescence intensity; Rot = rotenone.

