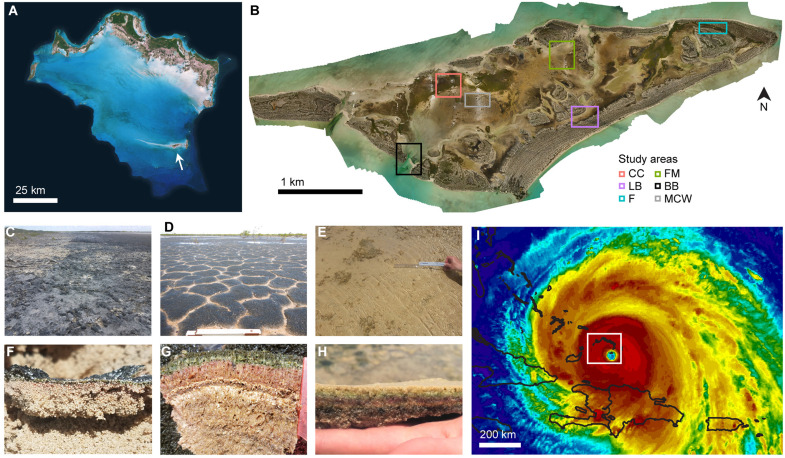
Fig. 1. Maps and context images.
(A) Satellite image of the Caicos carbonate platform, white arrow pointing out Little Ambergris Cay. (B) Drone orthomosaic of Little Ambergris Cay with study areas indicated. Aerial images of these regions documenting changes over time and sample details can be found in fig. S1. (C to H) Surface (C to E) and cross-sectional (F to H) photographs of end-member mat types—blister mats, of millimeter-scale thickness characterized by rough, black, or gray surfaces (C and F); polygonal mats, of centimeter- to decimeter-scale thickness with highly cohesive, often fibrous mat fabric and dark green tufted surfaces characterized by desiccation cracks that delineate polygons (D and G); and smooth mats, of generally centimeter-scale thickness and ranging in consistency from moderately cohesive to loose and goopy, often covered in beige exopolysaccharide material (E and H). (I) National Oceanic and Atmospheric Administration Geostationary Operational Environmental Satellite network infrared image of Hurricane Irma with the eye directly over Little Ambergris Cay on 7 September 2017, 22:45 UTC. Black traces indicate land masses, and white box indicates the area shown in (A).

