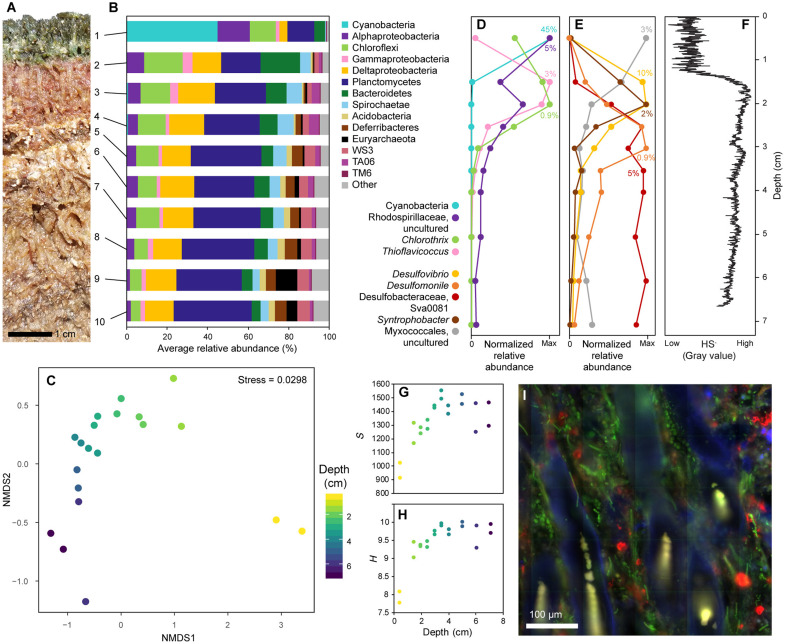
Fig. 2. Microbial mat stratigraphy.
(A) Photograph of CC mat cross section. Each visually distinguishable layer was sampled in replicate for microbial community analysis; the numbers to the right of the photograph indicate the horizons sampled. (B) Phylum level community composition of each layer; data shown are the averages of replicates. (C) NMDS plot showing variance in the microbial communities with depth. Each point represents a sample; relative proximity between points indicates similarity. Replicate samples are plotted separately, illustrating the minor amount of heterogeneity between replicates. (D and E) Normalized relative abundance showing the distribution of major groups of phototrophs (D) and Deltaproteobacteria (E) with depth, demonstrating the presence of an oxic photic zone, a sulfidic photic zone, and at least four distinct zones of organic carbon breakdown. Percentages indicate the abundance of each taxon relative to the full community, indicated at the horizon where their relative abundance peaks. (F) Sulfide profile captured on a silver strip, illustrating the porefluid chemocline from oxic to sulfidic ~1.3 cm below the mat surface. (G) Alpha diversity [observed operational taxonomic units (OTUs)] and (H) Shannon diversity [] of each sample with depth. (I) Fluorescence microscopy showing the complexity of spatial relationships and microenvironments in a mat slice. Red is fluorescence in situ hybridization (FISH) labeling of 16S rRNA with a universal bacterial probe; blue is 4′,6-diamidino-2-phenylindole (DAPI), a general DNA stain; and green is cyanobacterial autofluorescence.

