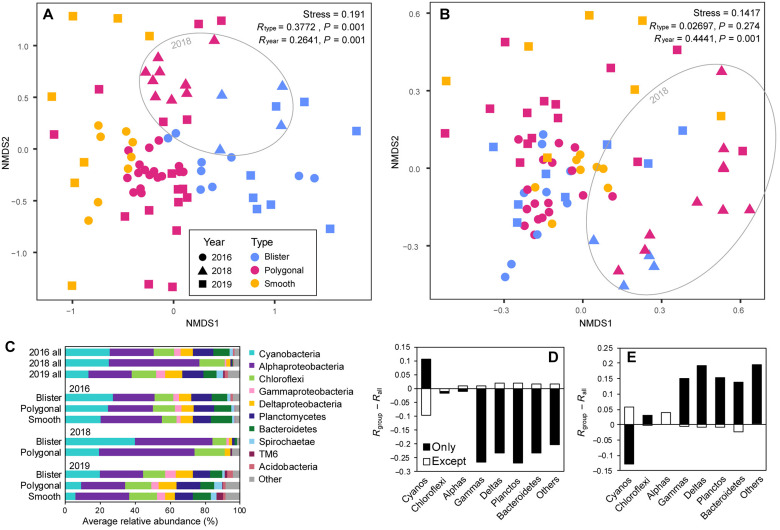
Fig. 3. Differences in bulk mat communities across space and time.
(A) NMDS plot visualizing variance, showing a clear trend between mat types along with a perturbation following the hurricane that largely recovered by 2019. Additional metadata variables can be found in figs. S2 and S7. (B) NMDS plot of phylum level rather than OTU level data. At the phylum level, the trend between mat types is lost, but the perturbation in 2018 remains clear. (C) Average phylum level community composition of all bulk mat samples from each year and of each mat type within each year. The individual samples included in these averages can be found in fig. S3. (D and E) The contribution of each major group of organisms to the community variance seen between mat types (D) and year (E), quantified as the difference in ANOSIM statistic R between the full dataset and the dataset filtered to include only a specific group of organisms (shaded bars) and the dataset filtered to exclude that specific group (open bars). NMDS plots accompanying these calculations can be found in fig. S4. The aspects of the community that varied most strongly between mat types and those most strongly perturbed by the hurricane are notably distinct—almost inverse.

