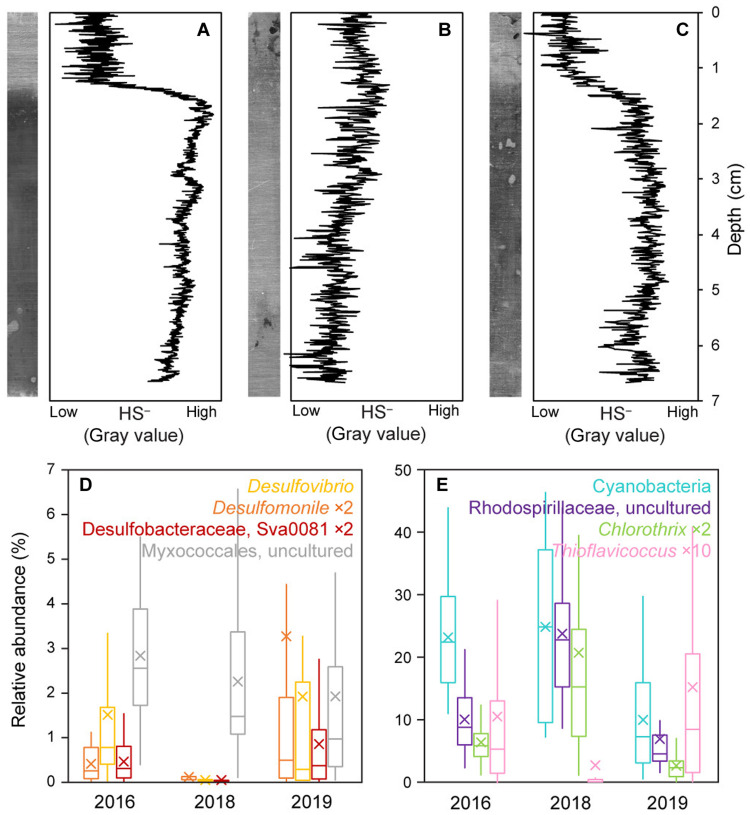
Fig. 6. The sulfur cycle recovered on a slower time scale than new mat growth.
(A to C) Sulfide profiles captured on silver strips at CC depth profile site in (A) 2017, (B) 2018, and (C) 2019, shown as both raw scanned images (left) and quantified by gray value (right). In 2017 and 2019, there was a clear sulfidic zone in the subsurface mat. In 2018, the year following Hurricane Irma, the mats did not appear meaningfully sulfidic at any depth. (D and E) Box and whisker plots showing the relative abundances of major Deltaproteobacteria (D) and phototrophs (E) in bulk mat samples from each year. Boxes denote first and third quartiles, horizontal lines indicate medians, x’s indicate averages, and whiskers indicate minimum and maximum data points. Taxa implicated in sulfate reduction or sulfide oxidation were substantially diminished in 2018, consistent with an impacted sulfur cycle.

