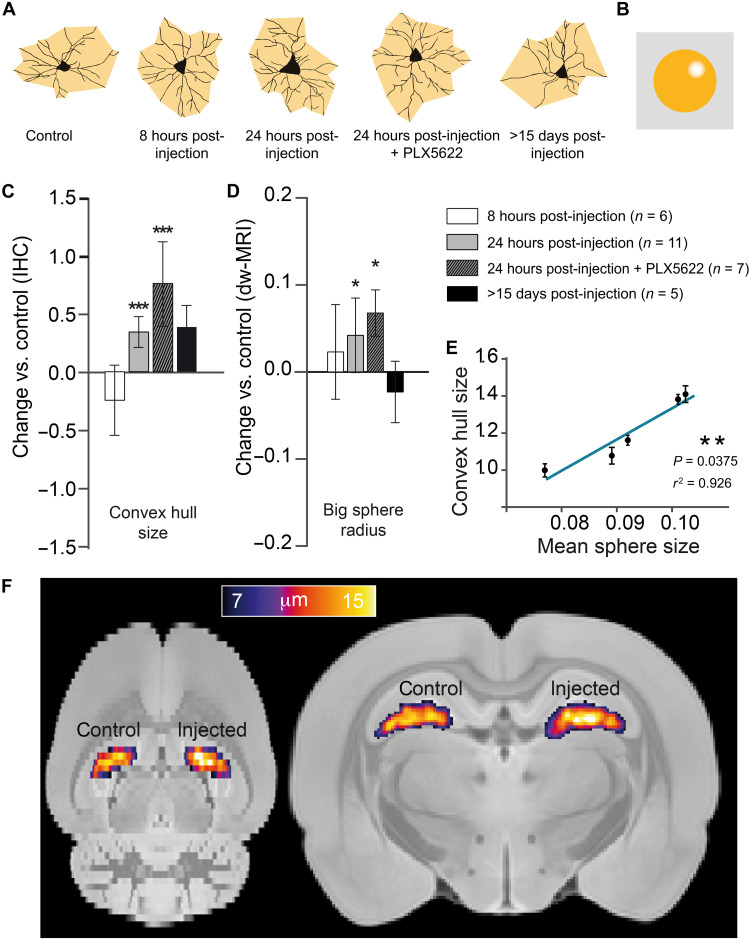
Fig. 2. Histological characterization of astrocyte reaction and its associated MRI signature.
(A) Morphology reconstruction of representative astrocytes at the different times in black and two-dimensional (2D) convex hull in orange. (B) Geometrical model used for astrocytes. (C) Normalized change (Pinjected − Pcontrol)/Pcontrol in convex hull mean radius for the injected versus control hippocampus, measured in GFAP+-stained astrocytes for the different groups. Asterisks represent significant paired difference between injected and control (***P < 0.001). Error bars represent SD. (D) Normalized change (Pinjected − Pcontrol)/Pcontrol between MRI-derived large sphere radius calculated in the injected versus control hemisphere for the astrocyte compartment (shown in the inset). Asterisks represent significant paired difference between injected and control (*P < 0.05). (E) Correlation between mean sphere radius from MRI and convex hull mean radius from GFAP. (F) Large sphere radius maps at 24 hours after injection, normalized to a rat brain template and averaged over all rats.

