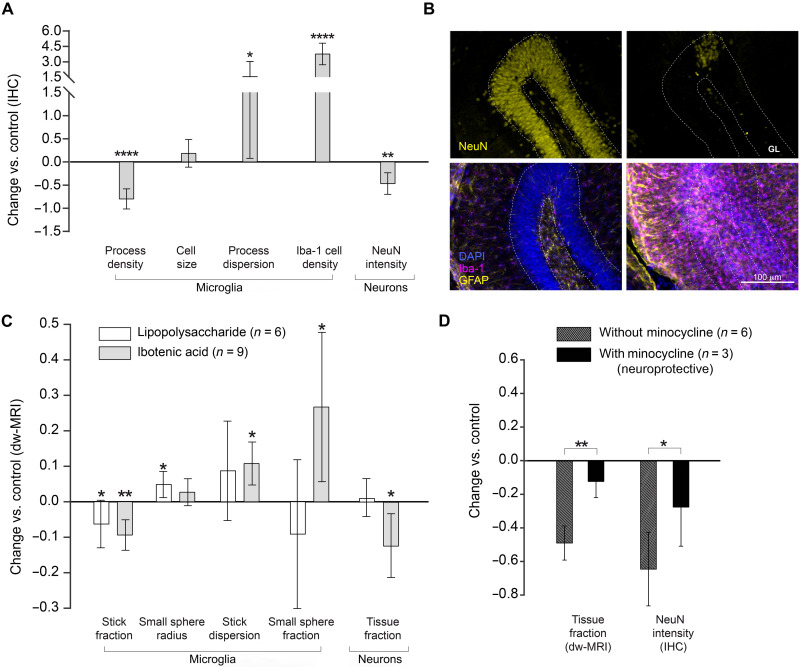
Fig. 3. Characterization of inflammation in the presence of neuronal death.
(A) Normalized change (Pinjected − Pcontrol)/Pcontrol in histological measures for the injected versus control hippocampus. Asterisks represent significant paired difference between injected and control (*P < 0.05, **P < 0.01, and ****P < 0.0001). (B) NeuN and GFAP–Iba-1 staining of a representative animal (left, control; right, injected). GL, granular layer. (C) Normalized change (Pinjected − Pcontrol)/Pcontrol in MRI parameter calculated in the ibotenic-injected versus control hemisphere for microglia and neuron compartments (light gray). For comparison, the same parameters obtained in group 2 of the LPS-injected animals are reported in white. Asterisks represent significant paired difference between injected and control (*P < 0.05 and **P < 0.01). (D) Normalized change (Pinjected – Pcontrol)/Pcontrol for MRI and histological markers of neuronal death calculated separately in the untreated animals and in those treated with minocycline. Asterisks represent significant unpaired difference between the two groups (*P < 0.05 and **P < 0.01).

