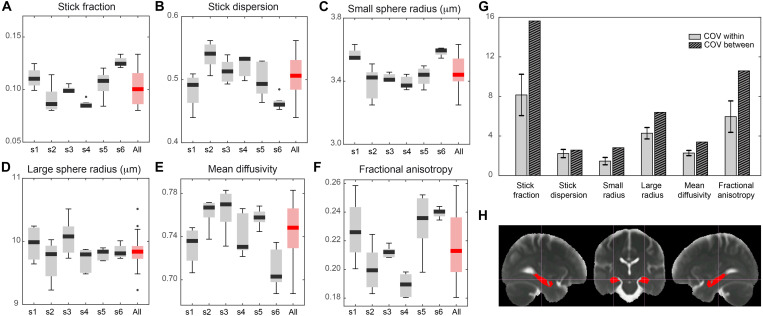
Fig. 5. Feasibility of the framework translation to human and MR parameter reproducibility analysis.
(A) Boxplot of stick fraction as measured separately in the hippocampus of six subjects scanned five times (s1 to s6) and pooling all subjects together (red). The same is shown for the stick dispersion parameter (B), small sphere radius (C), large sphere radius (D), mean diffusivity (E), and fractional anisotropy (F). (G) Average coefficient of variation calculated within subject (light gray) and between subjects (striped). (H) Region of interest (ROI) in the hippocampus used for the reproducibility analysis, defined according to (56).

